Wednesday, October 19, 2011

Nikkei Looks Ugly, Already Below Long-Term Support

I was going to post the chart for Shanghai Composite, which sits right on the support (may be breaking as of now today), then I found a chart that's worse: Japan's Nikkei.

3-year support was around 9,000, or about 50% Fib retracement. It's breached, and the effort to regain that support line hasn't gone anywhere. Now on the weekly chart, it is forming a bear flag.

The first target would be the March low of 8,227, then the full retracement back to October 2008 low of 6,994.

Friday, August 19, 2011

Gold $1,864 Spot

Well... Hardly trading ever since March 11's triple disaster in Japan of earthquake, tsunami, and broken nuke reactors at Fukushima (which turned my regular finance blog into Fukushima disaster blog) and simply sitting on gold double-long ETN has proven to be the best-ever strategy for me.

I have DGP, which went from about $40 in mid March to $67.61 today (August 18). My target has long been met without me even noticing it (it was somewhere around $52). Now that gold is in an uncharted territory (all-time high) and I'm yet to learn how to draw Fib lines forward, I'm using the Point and Figure chart to literally figure out my new target.


Looking at the chart, it looks like a break out from the pennant on a long pole. The length of the pole is $18, and the bottom of the pennant where the breakout has taken place is $62. The target would be $62 plus $18, equaling $80. That would translate to gold slightly over $2,000.

Not very far, is it? I will probably continue to sit on my holding as I see no reason to sell anything related to gold in the market environment like we've been having. I didn't even notice that the US stock market was tanking until about 2 weeks ago, but I'd better watch out for the entity who issued this ETN: Deutsche Bank (DB). I hope the German government will support the bank even in euro turmoil (or death dance).

(If hoping is not good enough, putting DB may work.)

Sunday, March 20, 2011

US Stock Market LOVES War... Futures Up Big

Bloomberg says Dow futures are up 73, Nasdaq futures up 13.5, S&P futures up 8.5.

Obama goes to Rio with his family, the US military starts shooting 120+ tomahawk missiles into Libya, and stock futures jump. Whatever. For those who are still in this almost immoral place which was once a stock "market", here's what I see TA-wise, using S&P500.


So far, the current correction, though it feels severe because it comes in the middle of geopolitical troubles in the world (plus 9.0 earthquake in Japan), is not very big one. Take a look at how the market corrected from May 6th flash crash. It took 5+ months to recover. The obvious resistance is 50-DMA, which sits at 1,302, about 23 points away.

Down volume is more significant than up volume, but again, the volume doesn't compare anywhere near the level seen in May and June last year.

I'm invested in gold, silver, and oil stocks and options, but I don't trade any more these days. I was too busy to cover AMZN short on Friday and close out all trading position. Oh well. My AMZN target was around $150, where the weekly 50-MA is right now. But I may just get out, depending on how much Ben and Timmy want to hype the stock market.

Monday, March 14, 2011

Ben and Timmy Did Their Job in the US, Nikkei Tanks the 2nd Day

For those who care, here's the real-time link of Nikkei.

As for Yahoo's SKF MB, stock peddlers and jerks abound (even a couple of new ones), which tells me to just hold what I have and sit tight. It's going down. (Do your scientific DD.)

What's interesting today was MTL, Russian iron ore company, up 3.5% for the day. Russia has promised to provide Japan with additional LNG and coal for power plants.

Sunday, March 13, 2011

On-going, Unfolding Disaster in Japan

News out of Japan is getting worse by the minute. Despite Bank of Japan throwing 15 trillion yen ($182 billion) to prop up the market, Nikkei is currently down 657, to 9,596.

I have no doubt of Ben and Timmy's power to prop up the US market, but frankly, I don't care. I have my friends and families and relatives in Japan, and I am too busy blogging on my other blog on the March 11 earthquake/tsunami disaster with information from Japanese news sources. I don't think I would be very much actively trading near-term. I'll hold what I have, which is gold/silver ETF and ETN, iron ore company (MTL), USO calls, VXX, and short AMZN.

Too bad I don't have any re-insurers. Or maybe none of them is public. I just don't know. General Re is a Warren Buffett company. Munich Re is traded on DAX, but it is also 8% owned by Warren Buffett. Hmmmm.

Last I checked, Yahoo SKF MB is still trolled by some jerks spewing venom, so the trend on this indicator remains down. Good luck, and batten down the hatches. The market will go down, if not tomorrow then later but it will go down. IMHO of course..

And don't, for a moment, think it's about Japan only. Financially, Japan is a huge market. Money and credit flow in and out of Japan will be severely impacted. China may have surpassed Japan in terms of national GDP, but in financial market size and complexity, it doesn't compare.

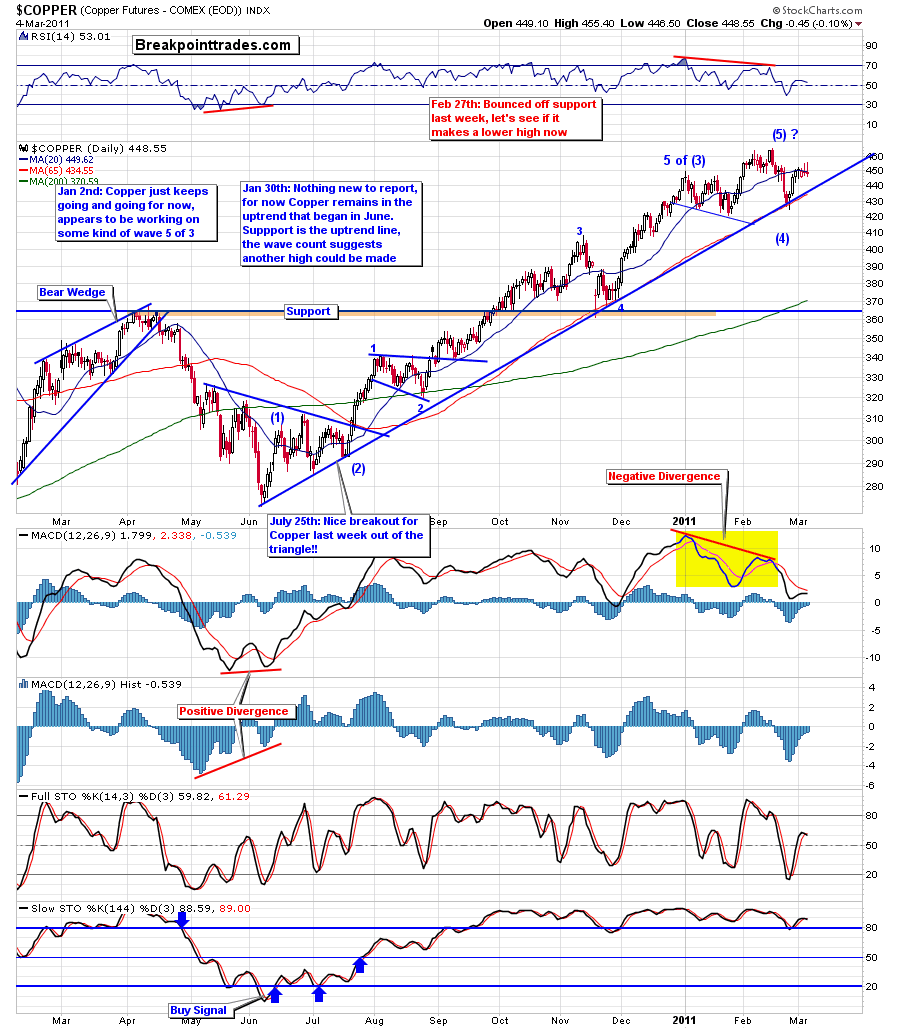
For your TA enjoyment, here's Breakpoint Trades guys' weekend newsletter (free, you can subscribe yourself, they are good).

If you are so inclined, please donate to your local Red Cross or Red Crescent or equivalent, or whatever charity that you prefer that is collecting money for the earthquake/tsunami victims in Japan. Japan is a rich country, but not rich enough to pay comfortably for such a disaster. Food, water, and fuel are in severe shortage in the affected area, where the night-time temperature drops below zero (Celsius).

Friday, March 11, 2011

Why Me, Worry? Says Ben (and Timmy and the Whole Crew)

This gotta be one of the biggest crap I've ever seen coming from Ben, Timmy, the whole PPT and TBTF Wall Street banks: to levitate the US stock market on a non-POMO day on a thin volume, after the massive earthquake in Japan and on-going and worsening turmoil in Libya and euro and the EU getting unhinged over debt crisis in PIG.

They've been throwing everything they've got on the market from the get-go.

The ostensible reason for today's gain? Because the oil price fell! Of course.

30 minutes to the close, Dow is up over 100 points, S&P500 up 13, Nasdaq 22.

US dollar is down big, gold, silver up, oil down, copper is up.

NFLX is still below 50-DMA (which sits at $204.03 today). For that matter, Nasdaq remains well below 50-DMA, despite today's advance.

Thursday, March 10, 2011

S&P 500 Intraday, 1-Hour Left

After breaking down from the symmetrical triangle that I mentioned yesterday, it is forming a second rising wedge for the day. Looks bearish to me, but MACD (not on the chart) does show a positive divergence. Probably in anticipation of the PPT.. It's possible that it will reverse upward in the final hour, so that the bulls at CNBC can call it "bear trap".

I don't quite care one way or the other, but I'm irritated with those dip buyers of AMZN... LOL. (But I'm still short.) And I'm mightily irritated with JPMorgue and the gang for banging the precious metals..

The chart is 5-day, 15-minute chart.

NFLX Intraday - Hit 50-DMA and Turned Back

(UPDATE) So that you know, 50-DMA is $203.62. 200-DMA is $159.41. It's trying again to break above 50-DMA...

--------------------------------------------

For now. Still 2.5 hours of trading left, not counting AH. Volume is running higher than yesterday, though doesn't seem to correspond with a large price movement (up over $7).

I would put it, with a target at 200-DMA (currently at $159), but I don't have extra money in my account... Do your own DD.

Wednesday, March 9, 2011

S&P500: Triangle Pattern Can Break Either Way

So I was told more than 3 years ago. I distinctly remember when: December of 2007. The market topped in October that year, in retrospect of course. The market sharply corrected, and then sharply bounced back in late November, and was chopping back and forth in December, forming a symmetrical triangle.

"It could break either way", a trader told his followers. It was very clear which side he was expecting: Up. The direction was finally decided in January, and it was down. The trader told the followers it could backtest the trendline and maybe retake it. No it didn't. It went down, down, down.

So, when I saw a triangle pattern on the current S&P500 - different time scale altogether, mind you - and was told by another trader "It could break either way", all I would say is "Sure it could." My bias is down, but I'm not the one to underestimate what Ben Bernank can do for the stock market with daily $billions.

The top is S&P 500 daily chart from October 2007 to January 2008. The bottom is S&P 500 5-day 15-minute chart, ending today (3/9/2011):


If it breaks to the upside, fine. I'll get stopped out of AMZN short and VXX long. I'm not worried about gold and silver stocks, because my costs are so low.

BTW, Dr. Copper has decisively broken below the trendline today.

(I'll just keep my Yahoo MB indicator in mind... The jerk is still there, though spammers are disappearing quickly. Spammers seem to have sensed a change in direction.)

Tuesday, March 8, 2011

Nasdaq Underperformers for the Day

Nasdaq is is up but underperforming Dow today (Dow is levitating on Bank of America Analyst Day in 3 years), but its major (momo) components are underperforming the index. Not a good sign.

The index is up 1% right now.

Nasdaq underperformers on my stock screen:

AMZN: down 0.50%
GOOG: up 0.65%
NFLX: down 5.21%
AAPL: up 0.48%
QCOM: down 0.75%
BIDU: up 0.16%
INTC: flat
RIMM: up 0.06%
CSCO: up 0.25%
ISRG: up 0.63%

On the other hand, overperformers are:

YHOO: up 1.44%
ORCL: up 2.59%
AMD: up 2.48%
WDC: up 2.85%

Monday, March 7, 2011

Watch Dr. Copper for Market Direction...

Copper, I've learned, tends to top before the general market does. It is at a critical support right now (on a log scale).

Here's the chart of copper from Breakpoint Trades guys. It is a still shot, EOD Friday. But today, copper sits right at the trendline from June 2010:


Here's a dynamic link to the chart.

S&P500 Ends Below Trendline On a Log Scale

On a linear scale, it sits right on the trendline from September 2010.

So here's the chart on a log scale. The index sits inside the lower bollinger band, thanks to the late buying (again). RSI shows negative divergence, but not on MACD, Slow stochastics. MACD histogram is negative. Despite the jerky moves every day, not much of a clear sell signal, yet.


It's hard to see on the chart, but the bollinger band is very tight, again. Big move coming? But then again, you wouldn't want to join hundreds of hedge funds who want to pick the top and be a hero.

If it is indeed correcting more than it already has, I've put Fibonacci lines in the chart. Don't hold your breath for the downside, because I don't sense much negative sentiment in the market. This may be just a minor correction, even smaller than the November 2010 correction (the pattern looks similar), and as soon as it retakes the trendline it may be off to the races again.

But then again, my personal, unscientific indicator is saying more downside. Spammers are still there. The know-it-all jerk is still there, spewing insults and calling the end to the downside. We'll see. I'm happy with all my positions - almost all long (gold, silver, iron ore, oil, VXX), and one short (AMZN). I'll think about the next move if the index retakes the trendline.

Friday, March 4, 2011

Friday EOD Ramp-up Time!

And here we go. Out of nowhere comes algo dip buyers - it's Friday, you know. You can't end the week on a depressed note...

At this point, I can only laugh.

USO July $42 Calls - Someone Bought 15,000 of Them Today

at $3.80 a piece. $5.7 million to put in the trade.

Just in case, near the close I bought that call option, @$3.90.

Thursday, March 3, 2011

Market Reaction Cheat Sheet for NFP Day

NFP - non-farm payroll. The announcement of the seasonally-adjusted, birth-death rate adjusted (in other words, duly rigged by the government) statistics on employment for February will be at 8:30AM EST Friday.

Zero Hedge has a handy cheat sheet on how the stock market acts on the NFP day, as I reproduce below. In essence, it can be summarized as: the market direction is up, whether it's a good number or bad number. In other words, BUY BUY BUY.

Zero Hedge's Tyler Durden says even if a nuclear war breaks out tomorrow, it will still be a toss-up.

J.P.Morgue's economist says the great number is in the stars. (Oh brother...)

Over-performers and Under-performers on Nasdaq

(UPDATE) AMZN, NFLX continue to weaken in the final hour, despite Nasdaq remaining strong. NFLX is back to flat. We'll see if dip buyers come in, oh let's say in the last 30 seconds?

----------------------------------

So the market gapped up on less than expected unemployment number and Venezuela's offer for mediation in Libya. Great. It doesn't matter that there aren't many job openings, and Libyan opposition has said no to the mediation. Oil and gold/silver selling off.

Nasdaq is the best performer today of the three major indices, up 50 points or 1.83%. I'm curious which stock is over-performing (going up more than 1.83%), and which one is under-performing. So, from my stock screen, here's the list:

Over-performers:

QCOM (2.87%)
ORCL (3.05%)
EMC (2.17%)
BIDU (1.97%)
RIMM (4.22%)
AAPL (1.90%)

Under-performers:

AMZN (1.01%)
EBAY (1.16%)
GOOG (1.48%)
NFLX (0.54%)
INTC (1.23%)
MSFT (0.70%)

AMZN and NFLX continue to be rather weak, even in rebound.

Overall market under-performers:

FCX (0.63% Dr. Copper is not doing too well.)
POT (0.21%

Wednesday, March 2, 2011

AMZN: What Now?

AMZN stopped today at a very inconvenient place for me. I've been short AMZN since Friday, when it couldn't retake 50-DMA, which also happened to be about the mid bollinger band. And after the negative divergence on Nasdaq played out on Tuesday, I remain short AMZN.

But today the stock managed (barely) to retake the bottom trendline of the expanding, rising wedge that's been forming since September 2010. The volume was lower than the previous two days. (I just noticed that it is right at the trendline in log scale.)


My target remains 200-DMA, about $152 ($20 from here), but slow stochastics (at 60) is also approaching the oversold territory (not there yet). I think I will have to watch how the stock handles the bottom trendline of the wedge to decide whether to bail here or hold.

A quick upsurge on a high volume, I'll bail. A struggle on a low volume, I'll hold. (I'm a chicken little.)

If I had paid attention to the slow stoch cross over, I could have shorted it at $187 or so, and covered right about now and moved on, even if there's money still on the table. Oh well.

By the way, my private unscientific indicator is getting worse - more spammers, more bickering, less posters. A big move is yet to come, it seems.

(Sure enough, the US stock futures are up big. Emini Dow up 71, Emini S&P up 9, Emini Nasdaq up 12. For what? No one knows..)

Tuesday, March 1, 2011

AMZN Had a Mini-Flash Crash Intraday

AMZN, which I'm still short, had a flash crash intraday... Also look at the huge buy earlier. Hmmm. Now come dip buyers.

Monday, February 28, 2011

Rebound to 61.8% Fib, Now What?

I should be getting used to it by now, but it never ceases to amaze me and sometimes nauseate me. The US stock market went up again today for no good reason other than Warren Buffett being bullish. Dow, S&P, Nasdaq all retraced back to 61.8% Fibonacci retracement; Dow and S&P past 61.8%, Nasdaq, barely. My short Amazon worked today, although I wish I had had enough money to put NFLX. Oh well. Can't win all the time.

So what now?Will it trace all the way back to the February 18 level and keep going up? I shouldn't be surprised, but as I said, it's nauseating, partly because it's been levitating like this for too long.

Here's the daily chart of Nasdaq. It was the weakest index today, along with Russell 2000 (so much for economic recovery and growth). I see negative signs - RSI, MACD and price in negative divergence, up-volume not as significant as down-volume, a hanging man formed today which could be a bearish reversal signal.


I am not shorting the market (just short AMZN), so if it keeps going up that should be good for my commodity stocks. If it corrects more seriously, that should be also good for my gold and silver stocks and VXX.

Friday, February 25, 2011

Dow Theory Also Worked...

Non-confirmation between Dow Jones Transport and Dow Jones Industrial was a warning sign for a market correction.

(Not that I was paying much attention to the Dow Theory. I was paying more attention to the Yahoo stock MB, as you know... They both ended up working.)

For more on the Dow Theory, read here.

Weak Rebound, Putting AMZN

My unscientific indicator (Yahoo SKF MB) is showing more signs of a major move still coming.

In addition to the know-it-all jerk, now there are stock peddlers (spammers) coming in. More ominously, there is some bickering among long-time posters. All of these all at the same time.

As I've said, this is just my personal, totally unscientific indicator. Don't quote me on it or count on it.

The US stock market is trying its best to put in a rebound, but S&P500 smacked right against the trendline (slightly above 1320) of the rising wedge that was broken two days ago.

I putted AMZN that was forming, I thought, a bearish rising flag on a very small volume, when AMZN was up 45 cents for the day. We'll see. One logical stop would be 50-DMA, currently at $181.83.

I'll put the charts later.

Thursday, February 24, 2011

Three Black Crows?

It's past midnight in California, and do you know where your S&P500 E-mini is at?


It's down 9.5 points (or 0.79%). The reason? I don't know. Asia was down big on Thursday, except for Shanghai and Taiwan, although the gains were very modest.

But if tomorrow is another big down day, the three-day pattern may resemble "Three Black Crows", which could be a harbinger of a much more serious correction.

GL. Be safe.

Tuesday, February 22, 2011

Watch for EMA Crossover on VIX...

So my know-it-all jerk indicator on the Yahoo MB worked again... at least for one day. AMZN calls got whacked, KO calls back to my buy point, MTL got whacked (down 5% - can you say "de-risking"?). And all that was made up by gains in DGP, SLV, and VXX. My portfolio was totally, absolutely flat for the day.

Now the US stock futures are already showing cheerful numbers like Dow +30. As if the 2% sell-off was all they needed to reload the longs (BTFD, as Merrill Lynch already advised clients).

That could well be the case, but I just wanted to link this interesting chart from the guys at Breakpoint Trades (they let you subscribe for their free TA newsletter).

It's a chart of VIX, except it's a chart plotting the two exponential moving averages (13 and 34) without showing VIX. Watch for a definite crossover of EMA13 over EMA34, after a positive divergence on EMA13. The last time that positive divergence happened was right before the last year's Flash Crash (May 6).

This time, relentless POMO bombardment unleashed by Ben seems so far to have retarded the spike on VIX. We'll see if bears can use the geopolitical turmoil to push for more downside..

Sunday, February 20, 2011

Thoughts at the End of a Long Weekend - A Big Turn in the Market?

I have an extremely unscientific indicator that has worked pretty well for predicting the direction of a next significant move in the stock market: Yahoo's stock MB for SKF.

When either of the following two happens, a significant market move may be near:

1. All of a sudden, a burst of new posters appear, peddling penny stocks, stock newsletters, winning strategies, etc.; or

2. A know-it-all jerk appears.

In both occasions, many long-time posters disappear, or post very infrequently.

When it is the case No.1, the market direction is usually down. The case No.2 can break either way, depending on which direction that jerk is proposing; in the past it often broke in the opposite direction.

As it so happens, the US stock futures are down big tonight, with Dow futures down 97 as of 11:29 PM EST, supposedly because of the "unrest" in Libya (it's a revolution).

But then it doesn't mean much to Ben and the Inkjets at the Fed. All they care about is how to pump the market using whatever means imaginable. I wouldn't be surprised at all if the futures go back to unchanged by the time the cash market opens tomorrow morning. J.P.Morgue seems to be very busy trying to suppress the price of silver, which has been beaten down from $34.40 to $33.40. (Friday's close was $32.52.) It is also trying to put gold down back below $1,400.

But my very unscientific gauge, Yahoo stock board, is flashing a warning sign that the market may be ready to move big, and I think it may be to the downside.

Whichever the direction may be, I'm pretty happy with what I've got - gold and silver shares, an iron ore company, a uranium company, and VXX. AMZN calls and KO calls will suffer if the direction is down, but I'm not too worried about them because positions are small.

Hold on to your seats...

Friday, February 18, 2011

2/18/11 Low Vol Op-Ex Day

like the last one.

Let's see, they (option MMs) would want:

AMZN below $185

GOOG below $630

NFLX below $230

AAPL below $350

So Nasdaq is dutifully in red, ever so slightly.

By the way, analysts and chartists have been saying this has been the late-stage rally, indicating this may be the major top. Calling the top has been a losing game ever since April 2009, but one of these days it will be the top. Whether it is next week, next month, or 10 years from now is anybody's guess, but we have Ben Bernank to the rescue....

Nothing to do here in the market but watch the silver squeeze (J.P. Morgue is trying its best to beat it back down) Enjoy your long weekend.

Wednesday, February 16, 2011

Update: Denny's (DENN) - Nice Intraday Recovery

Those of you who had wits about them early morning and bought the stock at the support (as I said yesterday, $3.50) were richly rewarded with nearly 15% profit for the day. Congrats (if any out there who did it...).

Tuesday, February 15, 2011

Denny's (DENN), Anyone?

(UPDATE) Denny's bombed on the earnings, missed the estimate by 5 cents/share. $3.50 seems to be the support since November.

Since the economy is improving so fast, supposedly, people may have moved to more upscale restaurants (like McDonalds). Or the weather was bad. Or margin squeeze due to high input cost (=food).

---------------------------------------------

The chart looks good. Oh I forgot TA doesn't matter any more. LOL.

It looks to me like a very large cup formed over 10 months, with the first target somewhere above $5.80. I think it may run above $6.50 (I'm looking at 10-year chart), given time. Technical indicators are not too great, but that hasn't stopped other stocks from going up higher. So far.

I have no position, and I just found out they are reporting after hours today (2/15/2011). Do your DD.

Tuesday, February 8, 2011

Q-Man (Quint Tatro at Tickerville) Seems to Be Catching On...

with the antics of Ben the destroyer of capital and wealth. Oh uh... My days of using him as contrarian indicator may be approaching to an end...

And here's a post from Washington's Blog, arguing that you cannot just talk about economics without knowing about politics.

I wholeheartedly agree with Washington's blog, and I would add that you cannot talk about investment or trading without knowing about economics OTHER THAN Keynesian or neo-classical economics. Why? Because Keynesian economics would uncritically approve of what Ben has been doing, and neo-classical economics would simply ignore whatever the government does.

I think investor/trader-friendly economics that provides you with insight and perspective into the government actions and non-actions and their effect on private businesses is the Austrian economics. But that's my take, and you should do your own DD. Good places to start doing DD is here and here.

Having a better, clearer idea of where all these (Barry's fiscal insanity, Ben's monetary insanity) has helped me stay in my positions in gold and silver and commodities. Today's purchase of KO? Well, that's more like calling Ben's bluff - the stock market will never go down as long as he's the chairman of the Fed...

Running on Empty? Who Cares? (Updated with KO Chart)

My call last November before Ben Bernank announced QE2 that Dow would reach 16,000 someday may not be far-fetched, and my target for S&P500 of 1,340 is just around the corner. My left-for-dead AMZN March call is coming back to life (AMZN is jumping over $6 today). All thanks to Ben Bernank, who only has our welfare in mind.

My latest purchase today is KO. Has a very peculiar chart formation, but I'm just looking at the buy signal in Slow Stochastic set at 60. MACD histogram shows positive divergence. Oh uh, tomorrow is their earnings report. Will it matter? Maybe. Maybe not. Here's the chart of KO, 9-month daily.


I also set up a call backspread on MTL, using April calls. It may be ready for a bounce here, after steadily losing all the gain from Feb 1, but it is at the support around $32.50. If I'm wrong, then I will lose out-of-pocket cost, which is about 30 cents (x100).

Do your own DD, but for me, I've sort of given up. If S&P500 can remain above 1,320, it could go up to 1,380 or so, then 1,440 (May 2008 top).

And of course I may be the perfect contrarian. If I am, I still have VXX....

Sunday, February 6, 2011

Out of Favor Trades: US Long-End Treasurys, Munis and USD

As I said in the yesterday's post, TA is broken, the stock market is broken, but those of us who still want to make money in the market can still look at the last remaining good TA signal - divergence. It has worked for me, most recently with ISRG.

I'm looking today at one of the three things that have been widely despised as close to worthless: US Treasuries, long-end. The chart is TLT, an ETF on Treasuries 20-years and longer. It is actually breaking down from the tight bollinger band, and whether it can snap back up from here remains to be seen. It has been pretty much in the lower bollinger band since late August/early September when Ben Bernank started QE Lite, and QE2 hasn't helped at all, contrary to what Ben said.

But what do I see in the chart? Positive divergence in MACD, and MACD histogram. RSI also has a slight positive divergence.


Checking on call options on TLT, I found a large volume on February $90 calls with the volume of 3677 with open interest of 1415. February $91 calls had the volume of 1862, but as a call spread it doesn't make sense. Checking the etrade intraday volume, the calls were being bought pretty much throughout the day for both strikes, not in one single purchase.

TLT ended Friday at $88.81.

The other one is US dollar, but I haven't seen the positive divergence on the chart yet, although it seem to sit at the point of "make or break". I think if the Obumbum's administration decides to do the American Homeland Investment Act Part Deux, it may be highly favorable to USD short-term. Combine that with the number of speculative short on USD in contrast to other currencies, and can we say "SQEEEZE"??

Munis are even more despised and hated, but it clearly shows positive divergence in MACD, RSI, and slow stochastics. See for yourself.

Do your own DD, and be safe. Although Ben's put seems eternal, if these three (Treasurys, munis, USD) dare follow the positive divergence and start going up, that may not mean well for his beloved stock market.

Saturday, February 5, 2011

Joe Saluzzi with Chris Martenson on HFT

Saluzzi confirms it is not a stock market any more, and carbon-based traders have no chance, and that technical patterns, which have worked for years and years, don't work any more.

The last one, that TA doesn't work any more, is what you suspect but don't want to admit. Looking at the market indices keep on levitating on ghastly volume, or certain momo Naz stocks just keep bid up no matter what, I've long admitted that is the case. I almost have a pity for people like Q-man who seems to earnestly believe everything is expressed in the charts and that most traders are still carbon-based, and who never even mentions HFT.

About the only aspect of TA which has seemed to sort of work in indicating the market turn is positive/negative divergence on some technical indicators - RSI, CCI, MACD, MACD histogram. But even that seems only allowed to work for a select set of stocks like gold and silver related ETFs and stocks (for obvious reasons - JPM, HSBC, Ben at the Fed...).

Here's the link to the podcast;

and the link to the transcript of the interview.

Sunday, January 30, 2011

Global Stock Markets - Negative Divergence Galore

Take a look at the charts from Breakpoint Trades guys:

Quick Snapshot of Some Foreign Markets

The US stock futures are down. Dow is currently down 24, but it was down more than 60 earlier. Ben Bernank to the rescue! He cannot let a pesky little people in Egypt ruin his perpetually levitating stock market, can he? Nooooooohhhhhh.

Friday, January 28, 2011

VIX Jumps on Egypt as Stock Market Dips

In the stock market carnage, particularly on Nasdaq, NFLX continued to go up. Oh well.

Other than the missed $400 additional gain if I held on to the option, my portfolio recovered some of the lost ground on precious metals (now that this punk trader finished liquidating his stupendous COMEX futures positions). He caused thousands of dollars of paper loss for me in such a short time, and I will make sure I'll have a word with him if I see him.

In the final minute of trading, I grabbed VXX, a very small position. It is an ETN on short-term VIX futures. Since this is an ETN, I didn't think it had options on it. Had I known, I would have just gotten the options. There is a scarier ETN called TVIX, that's leveraged.

VXX jumped 8% today with a huge volume.

The reason why is finally getting obvious to many people: Egypt.

Many inverse ETFs have been showing positive divergence lately. Here's what VXX looks like: a blip today after a long, long price decline as VIX was dying, but with positive divergence developing on MACD (the best indicator for me these days).


It's outside the chart above, but in May last year it went from $70 to $140.

Slow stochastics hasn't given a buy signal, but so? As Zero Hedge says, we're in one of the first "quantitative" revolutions. High VIX times, probably. If everything is dandy and nice again on Monday, so? It can simply collapse on Tuesday again. Who knows.

Be safe and do your DD.

Wednesday, January 26, 2011

Contrarian Trade Success No.2: NFLX

(UPDATE) out @8.86, 1/27/2011. Good enough.

-----------------------------------------------

IF the after-hour price ($202) holds tomorrow morning, that is.

After betting against Goldman on ISRG paid off big time, I was looking to put NFLX. It has had a phenomenal run, probably due for a decent-size correction. Their earning report on Wednesday AH seemed like a good enough trigger for that correction.

Then I read analysts' comments, and that changed my mind. They were almost all negative. I looked at the front-month options - more puts bought than calls. Then I looked at the chart. It wasn't great, with a recent correction, but I didn't see a negative divergence on technical indicators. The stock seemed to be building a base for about two months (ignoring a bump in mid January), as it worked off the MACD negative divergence from October to November.


Suppose it is a base that NFLX has been forming, and what would be the target price? I figured $205, to complete the right side of a cup. It if were to break out from the cup, the ultimate target would be $230 (cup depth plus breakout point). February 210 calls were selling under $3. I bought one at $2.84. All I would lose would be $2.84 x 100.

Barring unforseen disaster, it looks like I'll get my money back with some bonus.

Sunday, January 23, 2011

Tech, Small/Mid Cap Head Down While Big Caps Levitate

Just a heads-up for those who believe Obama is "pro-business". The two indices that represent growth (tech and small caps) may be heading south.

From the top: Nasdaq, Russel 2000, S&P500, Dow Jones Industrial Average.


Dow Jones Industrial and S&P500 continue to levitate, suggesting to me that they - big cap, multinational conglomerates - are the targets of Obama's affection for business. Like, GE.

Whether Dow and S&P can withstand the selling pressure coming from Naz and Russell remains to be seen. It is certainly possible, and may even be probable if the tax repatriation stuff passes Congress. After all, Dow and S&P500 are full of companies that stand to benefit from such a law.

Thursday, January 20, 2011

ISRG Surges AH on Earnings Blowout

(UPDATE 1/21/2011)

ISRG went as high as $334.39. I sold my option at $13.60, missing the top dollar at $13.90. Now I could care less if I lose my money on BAC and C... hehehe. Thank you Goldman for being a wonderful contra-indicator.

-----------------------------

ISRG (Intuitive Surgical) has always been an elusive stock for me; I can't develop a tradable feel for the stock, the price movement is always radical, both up and down, options prices seem always inflated and not very liquid.

Then, two days ago, a Yahoo SKF board member linked a sell recommendation by the vampire squid, aka Goldman Sachs. (h/t heartless)

It caught my attention because it was a rare recommendation (any "sell" recommendation is rare), and Goldman was recommending 2/1 put spreads on (I think) the front month. Clearly they were expecting a bloodbath in the earnings report, which was today.

Since the vampire squid's forex desk has been a disaster for the investors (they recommended short Euro at the last bottom at 1.18, among other fine calls), I decided to pull up the ISRG chart and see if there's a case against Goldman.

I thought there were. They're in the chart below, but particularly the positive divergence in MACD. And just to test my thinking, I bought one February out of the money call (@330); if I was wrong, I would lose $3 (x100, of course). $330 is where the stock runs into some overhead from May to August last year.


And this is ISRG after-hours:


Never trust the Squid.

Of course the Squid may attack AH or tomorrow to make sure the stock gets beaten back down and I still lose $3.

Again, never trust the Squid.

Friday, January 14, 2011

Goodbye VIX, and Death of Inverse ETFs?

Seems like it, though never say never. As VIX heads towards sub-10, it is killing the inverse ETFs like SKF. The point and figure chart of VIX has 7 as the target.

The chart below plots VIX and SKF.


VIX is about to break down from a double bottom. If this breaks, hello 7. The last time VIX dipped below 10 was in November 2006 - February 2007.

Bank Run Part 2: Citigroup (C)

I am clearly overdoing it, I know. But since my BAC call options have been a success for me (up 300% since Christmas Eve), I thought, "Whatever..." Ben's stock market put is solidly in place.

So I bought C, February 5 calls, 2 days ago. It sat there yesterday, and it moved up a bit today, on the wake of JPM's stellar 4th quarter results. One junk after another, you might say. If you think about them on fundamentals, there's no way in hell that you would want to touch them (other than Ben's put on the market). I am just looking at their charts, and BAC had seemed a good buy back then, and C looked good enough to buy 2 days ago, as it was breaking out of a short consolidation. (Some technicals are signaling a slight negative divergence - MACD histogram, CCI, RSI somewhat - but do you care? The only time the technical signals are followed is when they happen on gold and silver..)

Both C and BAC continued to behave well today. Then I just saw this chart posted at Zero Hedge, and now I know why, and the reason is called "short squeeze". C regained the top spot for the most shorted stock on NYSE, and BAC is ranked 7th.

Ooops... C will report its Q4 earnings on Tuesday 1/18 (premarket), BAC on Friday 1/21 (premarket). They almost always disappoint... Oh well. I guess I did push my luck one day too far. C'est la vie.

Wednesday, January 5, 2011

Bank Run Continues

I mean Bank of America's share price. Today it broke decisively above the 200-DMA on a larger volume than yesterday, though less than on Monday. Congrats to those of you who joined me. The stock almost reached the target price I mentioned, $14.56.

Now what? It is a good place to sell, though I have a feeling that there will be one more final push before it corrects, like April 2010. Look at slow stochastics at 60 and 133, and compare the present with April 2010.

One more push, and then WikiLeaks hits BAC...? Maybe. Maybe not. I haven't decided what to do with my tiny position.

Here's the Point and Figure chart of BAC. It was a bullish reversal day, with the bullish target of $22. I have little doubt that it will get there, thanks to Helicopter Ben. Just the matter of when.