Monday, December 28, 2009

TBT While I Wasn't Particularly Looking

It has broken out of a symmetrical triangle it's been forming since October. It has even already backtested the upper line of the triangle, and it's now off to the races.

TBT is a double-short ETF on Treasuries 20-years and longer. It is a double-inverse of TLT. As those longer-dated Treasuries prices fall (thus their yields go up), TBT goes up.

There are even more leveraged inverse ETFs like triple-short 10-year Treasury (TYO) and triple-short 30-year Treasury (TMV) but they are very thinly traded for my liking.


It looks like I've missed the boat on this, but I think there's still some upside left on this leg. It can run up to $55 or so (target price derived from the height of the symmetrical triangle), where it meets a horizontal line that marks the previous resistance/support.

What's interesting to me is that TBT broke out and continues to go up, DESPITE the dollar strength (take a look at the top of the chart - that's US dollar movement). So, as I mentioned in the post a few days ago, the U.S. dollar "strength" doesn't mean investors are flocking to the U.S. dollar denominated "safety" assets like Treasuries. It is rather other currencies' weakness.

Saturday, December 26, 2009

Another Leg Up for JASO?

I played JA Solar (JASO) on December 14/15. I bought the breakout on a huge volume, sold one day later for a tidy profit. It may be forming a bull flag (a continuation pattern after a sharp movement), and getting ready for another move up.

JASO's chart is rather messy, but short-term, as you see, the resistance was around $4.90. That's where it turned back on December 8. Then for three days it declined on a very low volume. I was watching to see if it breaks out on a large volume, and sure it did on December 14.


I continued watching to see how it behaved after the breakout, and I decided I liked what I saw, a bull flag. So I bought it again, with initial target around $7.50. There is a very thin zone between $7 and $9, so it could run up to $9 in a relatively short time. The point and figure chart of JASO shows the target at $10.75. But it all depends, I think, on how the general market is going to act. (At the moment, I continue to think Dow and S&P will follow Nasdaq's lead and go up to 61.8% Fibonacci retracement.)

This is nothing fundamental, just technical. I don't even like solar stocks as a sector (I don't quite believe in a private sector that constantly needs public subsidies). But a trade is a trade, and it's a good one that makes money.

Tuesday, December 22, 2009

Other Currencies Are Sold, Not US Dollar Being Bought

Or so it seems to me. U.S. dollar has had a sharp reversal upward ever since Dubai announced the debt freeze very conveniently on Thanksgiving Day when the financial markets in the U.S. were closed.

Convenient in two ways: one, the U.S. dollar index (DXY) was just starting to bust the tenuous support around 75 to go down lower when Dubai announced its intention; it was also convenient for the commercial players in the U.S. dollar futures market, who had been net long U.S. dollar since this summer.

The sharp rise is attributed to the usual stuff: flight to safety and liquidity of U.S. dollar and dollar-denominated securities. I don't quite understand why the currency of a country whose government continues reckless spending is safe, but that's what's been said.

But is it the strength of the dollar, or the weakness of other currencies, particularly Euro and British Pound? And while the dollar has been ramping up with no fundamentals underneath it (as I can see), why aren't other U.S. dollar-denominated securities like Treasuries, agency bonds, MBS getting the bid?

When I created this chart below and took a look at it, I came to a conclusion (for now) that it is the weakness of other currencies. Why? Because it is only the U.S. dollar currency that has been bid up since Thanksgiving Day. Short-term Treasuries are flat, no bid for agency bonds and MBS, and long-term Treasuries are being sold and yields are rising. The lines represent different ETFs as proxy for underlying currencies and bonds.


UUP: US dollar ETF
FXE: Euro ETF
FXB: British Pound ETF
FXY: Japanese Yen ETF
SHY: 1-3 year Treasury ETF
TLT: 20+year Treasury ETF
MBB: MBS ETF
AGZ: Agency bond ETF

Monday, December 14, 2009

If Oil Is To Bounce, It'd Better Do It Now...

Here's a daily chart of UCO, double-long crude oil ETF. It's been bouncing within the channel (black lines), and it hit the lower line, yet again. Will it bounce? My bet is on the bounce, as the U.S. dollar is short-term overbought, and commodities oversold.


So I figured this might be a low-risk entry, and bought January call options (strike at $11) for a quick swing trade. My target is a bounce up to $11.75 area. There is a zone right above that level, full of gaps. If the dollar corrects some more and if traders become more optimistic about the elusive "recovery", it may go through that thin zone to slightly above $13.

The uncertainty is, again, the Fed FOMC meeting that starts on Tuesday, with the announcement on Wednesday after 2:00 PM EST. That almost always screws up the stock market movement.

Gold's Royal Pain

It's been a torture for long-term holders of gold and silver-related stocks (myself included). Every day gold spot price tried to move up, but as soon as the U.S. stock market opens the U.S. dollar strengthened and gold sold off much more than the dollar's appreciation. The stock market ended up for the week, but my portfolio cratered because of the large gold/silver/miner stock positions.

On Friday, maybe, just maybe, the slide may have been arrested. On a daily chart, GLD, gold-tracking ETF, stopped at $109.32, right above the 50-DMA which has acted as support since August.

Below is a weekly chart of GLD with three sets of Fibonacci retracement lines. GLD seems to have stopped at 38.2% Fib line from the most recent run-up, which is about the same as 50% Fib line from the breakout from the long-term resistance (and therefore now hopefully a good support) around $100.


One great lesson for me was that I have to remember I am trading the paper gold and silver (ETFs and ETNs), not the physical gold or silver. I could have sold all off near the top and bought back, say on Friday. Transaction costs are negligible. But I held on to them as if they were physical.

Oh well. The gold spot is currently up $8.40 at $1,123.50. We will find out soon enough whether the gain holds when the U.S. stock market opens.

Thursday, December 10, 2009

Big Move Coming: Bollinger Bands Tightest in 2 Years

so says Breakpointtrade.com. They are hoping to trade the break to the upside, but are also ready to trade the short side should the break be to the downside. And they are urging us to be ready, either way.

Here's a partial screen capture of the bollinger bands on major indices from their newsletter on December 9, 2009. The anticipated big break didn't happen today. Thrill and suspense. I am yet to get ready for the short side though.


And here's the link to their Wednesday newsletter. You can sign up at their website to receive the newsletters for free.

They also mentioned trading ideas in the newsletter. Two of them happened to be the stocks I've been watching to enter on the long side: IBM and POT. Other ideas that looked interesting was ALB, JASO, and GD (all long), and NKE (short, but only if the general market breaks down). Please do your own DD.

Sunday, December 6, 2009

Gold Correction? Consolidation?

After tagging the all-time high of $1,226/ounce on Thursday last week, gold crashed on Friday on the strength of the U.S. dollar after the November unemployment number was announced. It sold off more than just just the dollar strength. The rumor was that the investors had margin calls and sold gold.

I don't know if they were margin calls on gold trade or the U.S. dollar trade. One possibility is that investors who were short U.S. dollar had to cover and unwound their carry trade (long gold).

A correction was overdue, as many say, as the rise after the October breakout was almost vertical. The candlestick formed an inverted hammer last week, indicating the trend change. The question is, how low will it correct?

This is a 3-year weekly chart of GLD, the ETF that tracks gold price. On Friday, the fall was arrested near 61.8% Fibonacci retracement from the long-term support (and neckline of the reverse head and shoulders) to the Thursday top. Since the rise in the past three weeks was particularly rapid, it could retrace back to 38.2% Fib, around $107, filling the gaps.


Slow stochastic (60,3) is still above 80 on the weekly chart, though it may be breaking below the recent trendline support. AROON's red and green lines are still very much apart, though this is a lagging indicator.

Looking at the previous breakout and correction (blue Fib lines in the chart), the level from which the breakout occurred held in the correction ($68.80). If that were to happen again, then the $100 level should hold.

The general market has been very volatile intraday these days, and the bollinger band on the major indices are contracting on the weekly charts. (Take a look at the latest newsletter about general market from Breakpointtrades.com.) Wait and see seems to be the name of the game for now for both gold and the general market.

Tuesday, December 1, 2009

What's With AAPL?

Apple (AAPL)'s relentless march upward since March this year seems to have stalled for several weeks. 7 weeks, to be exact. After the stock jumped on the earnings report, it has stayed in a narrow range for the next 6 weeks while other Nasdaq beta stocks like GOOG, AMZN, PCLN just keep going up.

AAPL may be forming a flat base. Just maybe. The volume in the past 7 weeks is low, with one distribution week. A flat base, if I remember O'Neil's book (How To Make Money In Stocks: A Winning System in Good Times or Bad, 3rd Edition), is one of the most potentially powerful base from which a stock could explode upward. If that's the case, the breakout point is $208.81, 10 cents above the base high.

Here's a 2-year weekly chart of AAPL. AROON (a lagging indicator) green line is drooping down to 70, entering a danger zone of potential sell-off. MACD and slow stochastics still look good enough, with no diversion. The candlesticks on the chart for the past seven weeks are getting tighter, after initial swing up and down.


Chicken Little in me says "It's going to break down big (and take the market with it!)!!" But if this is a flat base, or if this is a super-deep cup (that was formed over 18 months) and high handle, the target price is somewhere above $300 (depth of the cup added to the handle break). ($300?? Yeah right... right?)

I frankly don't know what to think. The last time AAPL stayed at the same place was back in June this year. It was floating around $140 for 6 weeks, and on the seventh week it burst upward. I caught that ride up. Could that happen again? We will find out soon enough, I hope.

Sunday, November 29, 2009

Limitation of Technical Analysis

Tickerville's Quint Tatro (whom I took a webinar on TA from, and whom I've been using as one of my contra-indicators since April this year - sorry Quint) continues to be bearish.

He starts this Tape Talk, talking about how Friday's 3.5 hour market had a significant volume distribution, without even mentioning Dubai.

Tape Talk (11/29/09)

I'm wondering if this should be the last time that I even link to his analysis... (If you are his fan, make sure you bookmark his site.)

Without macro (financial, economic, political, even social) understanding (or at least an attempt), the investment/trading becomes reactive to the events (like Dubai) as they unfold, and technical analysis becomes justification after the fact.

Now the guys at Breakpointtrades.com, from which I receive free TA newsletters sent out Early Friday alert after Dubai debt crisis caused the U.S. stock market futures into deep red like it were September 2008 all over again. The alert arrived in my Inbox at 3:01AM PST on Friday, with 43 charts no less, so that we would be prepared mentally for a potential big gap down. They are also technical traders, but they seem to put TA in bigger context.

Early Friday Morning Market Newsletter Special Edition (11/27/09 Breakpointtrades.com)

I trimmed my holdings somewhat on Friday, but more of a housekeeping and not a panic selling. It was a gap down alright, but the indices went nowhere near what I was prepared for (at least not yet, it could still happen), and a peek into the Breakpointtrades.com guys' charts helped calm the nerve. (Disclosure: I'm not paid to recommend their site or their service.)

Thursday, November 26, 2009

Batten Down the Hatches, Probably...

Thank you Dubai for the Thanksgiving surprise!

This is one of those events that defy technical analysis. You can't predict the event like this by looking at the chart. Asian markets are having a second day of severe down draught, with Hang Seng and Seol Composit leading the way. European bourses are sure to follow, which will be followed by the U.S. market. Dow futures are down 250 points as of 00:16 AM EST. I don't remember seeing the Dow futures this much in deep negative territory even in September/October of 2008.

The chart below is a 2-year Dow weekly chart, just to show the Fibonacci retracement from the March bottom to November top to see how low the index could fall. 61.8% line seems to offer a solid support, which is around 8,960. Back to the level in July. In between, 10,000 and 9,500 have some support, as they were resistance on the way up.


One of many things I regret for not having paid attention is Dubai's world-tallest skyscraper. When that building (still under construction) became the tallest in the world, it was September 1st, 2008. Right before everything went to hell in the stock markets worldwide. I had read about the "skyscraper index" back in January 2008, but I didn't connect.

It would be ironic if another Dubai incident (this time a threat of sovereign default) marks the beginning of a significant leg down in the market, which Elliott Wave people call P3, last leg of a bear market which will undercut the first leg low.

Tuesday, November 24, 2009

Dow Jones Intraday and Linear Regression

This is today's Dow Jones Industrial intraday. I was just watching the market today, mostly, and this is what I was watching: linear regression line.

I plotted the top line connecting the peaks, more or less, and the bottom line connecting the bottoms, more or less. I decided to ignore the spike down after 10:00 AM PST as reactionary low. I drew the center line right about the middle. And after 3:00 PM EST I thought, well I think they are going to park Dow right about 10,434. Sure enough, Dow ended the day at 10,433.

I've noticed that the Fibonacci retracement numbers and linear regression work better these days. Just my feeling. It could be because of those algo computers are programmed with numbers. I would be impressed if they are programmed to recognize patterns like "cup and handle"...

Saturday, November 21, 2009

Nikkei and Dow, Since 1984

Japan's Nikkei must be the saddest stock index in the world. At least so it seems to me.

Nikkei is again (third time) lower than the level in 1984, and that's 25 years ago. "A lost decade"? Here we may be potentially talking about "lost three decades", and possibly hoping that it will stop at "three decades".

Sunday, November 15, 2009

Japan's Nikkei Looks Sick

When Dow, All Ordinary, Hang Seng, BSE, just about every major index in the world jumped after the full moon in early September, Nikkei didn't join the party. It ended the month down. After the sharp correction worldwide in the second half of October, the indices are off to the races again after November full moon. Except Nikkei.


According to Bloomberg, currency traders are increasingly bearish on Japanese yen and betting against it, predicting 10% or more fall from the current level (around 90 yen/dollar). The new government (Democratic Party of Japan) is still learning its way in and around the system, but more government spending and falling tax revenue with a shrinking population doesn't augur well for their misguided efforts.

FXY is the Japanese yen ETF. EWJ is the ETF that tracks stocks on Tokyo Stock Exchange. You can short the ETFs, or buy put options on them if you share the bearish sentiment about the world's second largest economy.

Friday, November 13, 2009

Nasdaq Betas That Don't Come Back Down

With just about every analysts eager to call the top, the market marches on, bid or no bid. My portfolio has been rather stagnant for 2 months, with gains in precious metal stocks offsetting the weakness in financials. Probably a top is near, therefore, but I don't think the market will crash back to, say Dow 6,000, right away as some of them proclaim.

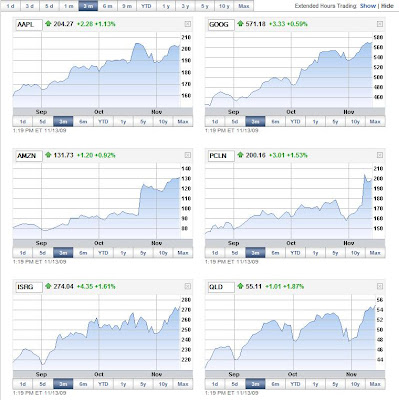
Why? Nasdaq "beta" stocks: AAPL, AMZN, GOOG, ISRG, PCLN.

They refuse so far to correct much. AAPL corrected the most after earning and filled the gap. But others, particularly AMZN and ISRG, hardly looked back, and has since resumed the upward march.


How much upside could there be for the major indices? Another 10%? 5%? I am debating whether it is worth to stay in the market, but when I look at these Nasdaq tech stocks it is tempting to believe this is a new bull market, in which you would buy stocks on the breakout from the high.

Thursday, November 12, 2009

NYSE Summation Index (Cumulative) Still Bullish

It's not the kind of index you hear or see very often. This is one of the charts that the guys at Breakpointtrade.com use for the market's bigger trend. (I am signed up to receive their bi-weekly newsletter. These guys are good.)

I recreated it using Stockcharts.com. As you can see, it gave a buy signal at the end of March. It didn't pick the bottom precisely, but really very good enough signal to get in. Ever since, the index (cumulative) remains up-trend, and CCI set at 13 hasn't dipped below 100, i.e. no need to sell my long positions in a hurry, yet. S&P 500, which is plotted at the bottom of the chart, still manages to maintain the uptrend line since March. If you are not so much concerned about day to day fluctuation, this summation index gives a pretty good signal.


If you use it, make sure you plot the chart as "cumulative".

For those of you who want to know what the heck is the "summation" chart, here's the explanation from Stockcharts.com.

Tuesday, November 10, 2009

Beaver Moon Did It Again...

The U.S. stock market bounced on the full moon (Beaver Moon), yet again. Just when I started uneasy holding long positions after seeing high-volume selloffs (that clearly signal distribution - pros are getting out).

This moon cycle pattern was first mentioned back in September by one of the members (a very strange one, too) on the Yahoo SKF message board. I laughed, but I didn't sell out, partly because of his insistent comments. Another bounce occurred on October's full moon. And another on November's full moon, which has now sent Dow to 2009 high. This latest full moon, I learned, was considered the most powerful full moon in 100 years, according to this Indian guru. (The link was given to me by my primary physician.)


This is a daily Dow chart, marked with green arrows for full moons, and red arrows for new moons.

Please don't trade on the moon cycle unless you do your own DD (I don't know how you do DD on moon cycle but...) and are convinced of it. I am definitely not recommending anything here. It's lunatic, literally. And MACD and RSI both show negative divergence, although slow stochastics (60,3) is nicely above 80 again.

Negative divergence on a short-term daily chart usually indicate a correction is imminent, and I thought we would get that correction today. All we got was S&P500 down 0.07 points and Nasdaq down 2.98 points. Instead of selling off, Dow managed to go positive. What do I know? (Can't win against Goldman Sachs, who's doing "the God's work", can we?)

Wednesday, November 4, 2009

Expanding Wedges on VIX

I've read that an expanding wedge pattern near the top after a prolonged upward movement is bearish, a topping pattern.

What about an expanding wedge near the bottom, after prolonged downward movement? Is it bullish? Bearish? Anyone?

Because that seems to be what I'm seeing in the VIX daily chart. Not just the index movement, but also RSI, MACD, and slow stochastics (12,3).

Wednesday, October 28, 2009

Is the Rally from March Finally Over?

For the first time since I went long back in March, I am shopping for short ETFs.

The major indices dumped big time today, after a tepid attempt to reverse the trend yesterday. Since last Friday, Dow has lost 347 points, or 3.4%, S&P 500 lost 54 points or 4.9%, and Nasdaq lost 131 points or 6%.

September had a similar mini-crash that brought the indices to their 50-DMA. June was worse, to be sure, and the indices dipped below 50-DMA and 200-DMA (crossover was happening then, so it didn't take much to go below 200-DMA).

What I don't like about it this time is the behavior at the top, from October 19 to 23. The daily movement was loose and wide. 100 point reversals, big down day followed by big up day. What does that remind me of? The market top in October-November 2007, and September 2008 right before the crash.

This is a 7-month daily chart of Dow. Negative divergence between RSI, price, and money flow are more prominent and consistent. It decidedly broke the trend line from March low today, and can go down to the trend line from August. That trend line forms a rising, expanding wedge, which is bearish and indicating the topping action. Using the slow stochastics with (5,3) for short-term trend, the index is short-term oversold, which is about the only good thing about the chart for market bulls.


Goldman Sachs lowered their estimate on the 3rd quarter GDP today, one day before the announcement. Market reaction to economic/financial news (ever since the new moon, come to think about it) has been negative: good news is perceived as not good enough, and bad news is perceived as worse. If this trend continues, the reaction to GDP number may be negative, no matter what the actual number will be. If that happens, it may finally be the "batten down the hatches" time, and time to make money on the short side.

Still, stochastics is short-term oversold, and the put/call ratio (a contra-indicator) has spiked up to 1.11. A bounce may happen soon. Another contra-indicator is that too many traders and pundits are now very bearish, calling the top for the year (even Jim Cramer).

Well, the proverbial broken clock is right twice a day...

Thursday, October 22, 2009

Now It's AMZN's Turn!

Nasdaq beta stocks are back with vengeance. First was Google (GOOG), then Apple (AAPL), and today was Amazon (AMZN). It announced a steller quarter result after hours and the stock jumped to $106. In this deep recession, the company's profit jumped 62%. If the AH price holds at Friday's closing, it will be ALL TIME HIGH for the stock.

This is the monthly chart of AMZN since its IPO. I don't care to do the TA analysis on a wild-looking thing like this. I'm just impressed. Usually when a stock falls from the crest (like Nasdaq dot-com bubble high), it doesn't recover. But this one did, and is about to take out the previous high.

I've been the customer ever since AMZN opened its virtual door. Its CEO, much like AAPL's CEO, has just kept at it, instead of selling out, retiring, or going into philanthropy.


About the only thing I can say about the chart is that the trendline held at the bottom, and it was a buy when it bounced off that line in November last year, at $34. It is quite possible that a few years from now I may be asking myself, "So AMZN was only $100. What was I thinking?"
Maybe I should think the unthinkable and buy the breakout.

Monday, October 19, 2009

Nasdaq (and Dow and S&P) at 2009 High

To the chagrin and frustration for the bears, the stock market keeps going up. Today, all three major indices marked the 2009 high with healthy gains but subdued volume (Op-Ex fatigue, maybe).

Barring disaster overnight (and premarket tomorrow), tomorrow's market looks brighter as Apple (AAPL) announced a blow-out earning after hours (the company sold more Macs and iPhones in any quarter in company's history), and the stock is currently trading over $200.

I haven't looked at Nasdaq chart since June (as I don't have tech stocks like I used to), so maybe this is a good time to do that to figure out whether every bear is saying is true ("the market is topping").

The first thing I notice about Nasdaq is the volume. Unlike other two indices (Dow and S&P500), Nasdaq's volume has remained robust. So far, I don't see negative divergence between RSI, price action, volume, CCI, slow stochastics. This is a very strong chart. About the only thing that makes me nervous is the extremely steep ascent from March low (steepest of the three major indices).

Around March 09 bottom, that was clearly a double bottom formation with handle, and the handle break in late May held. I should have paid more attention to Nasdaq around that time, for obviously easier money was in Nasdaq.

The index is right now between 50% and 61.8% Fib retracements, and 61.8% retracement is a logical target (2251). If 61.8% retracement is taken out (75 points away), it could go back up to 2007 high, I suppose. Some of the index components are already in that territory, about to take out all-time high (AAPL, BIDU, AMZN). Semiconductor sector is not acting well, despite the steller result from Intel (INTC). We'll see.

I don't quite see the topping formation on Nasdaq. The ascent has been steep, yes, but so far none of the indicators show overbought condition or trendline break. I personally prefer it would go sideways for a while, but what I think counts nothing toward making the market.

It's been a scary ride holding long positions (some positions as early as March) but I'm still holding most of them. Scary but lucky ride so far.

Thursday, October 15, 2009

USO Jumps

one day after I sold out my call options (at $0.90) at a 10% loss. If I had waited till today, I would have gotten out with 60% to 100% profit.

Lesson: If I intended to be a replacement for DXO, I should have bought longer-dated options, not October (duh). I could have gotten UCO, double-long oil ETF.

As October options expire this week, I was under pressure to get out yesterday when USO perked up. I probably should have done some quick TA to see if there was more upside. But with US dollar tanking like it did yesterday I thought the rebound would come today and the option was expiring fast. US dollar rebound came, albeit weak, but oil keeps going up.

Oh well. It could have been much worse. At one point in October, that particular call option was $0.20.

(Still it irritates me... Missed by the day!!)

Tuesday, October 13, 2009

TLR!!!

So far so good. The price held on Monday, and on Tuesday the stock jumped nearly 30% on a high volume, probably on this news:

Timberline Resources: Pump Up the Volume
(10/13/09 Market Watch)

"COEUR D'ALENE, Idaho (TheStreet) -- Timberline Resources (TLR Quote) shares rallied sharply higher Tuesday on heavy volume after the company increased its gold mineralization estimate on a joint venture project. "

"Timberline Resources said it has completed an updated calculation of the estimated gold mineralization at its Butte Highlands Gold Project joint venture, increasing its total anticipated mineralization to over 750,000 ounces of gold at an overall grade of 0.26 ounces per ton. "

Gold hitting a new high of $1069 per ounce helped.

Saturday, October 10, 2009

TLR

With part of the proceeds from ABK sale, I bought another bit stock. Not for investment, just like ABK wasn't, but for trade. More like gambling. If I lose, I lose. If I gain, I may gain big. (I did put in the stop so that I wouldn't completely lose.)

The stock is TLR, Timberline Resources Corp. It is a gold, silver and zinc prospector based in Coeur D' Alene, Idaho. I was watching the stock while it was spending the entire September around 70 cents, while the other gold miners advanced. Then it took off all of a sudden on Tuesday (10/6), and jumped to over $1.30 on Wednesday (10/7) on a gigantic volume for the company. Then it sold off for two days, and stopped at $1.05 on Friday before it rebounded back to $1.12.

The chart is a 3-year weekly chart to get some perspective, as the short-term daily is just too wild to figure anything out.


$1.30-1.40 looks to be a long-term support/resistance line, and sure enough the stock retreated when it hit $1.39. RSI and MACD showed positive divergence vis-a-vis stock price late last year and earlier this year. Slow stochastics at 60,3 (long-term trend indicator) has popped up above 20 for the first time since June 2008.

From the chart setup, the stock could go to $2.50-2.90 area. Point and figure chart of TLR says it may go above $4.

I bought it at $1.10 and put in the stop loss order at 87 cents, which is the September high. I think penny stocks are penny for a reason, and it is quite possible that my stop gets hit on Monday. If that happens, oh well. I will have still retained the profit (though reduced) from ABK sale.

Wednesday, October 7, 2009

Rio Tinto (RTP): Ready to Shine Again?

Australia seems to be the place to be, as far as the economy goes. Never in recession, Aussie $ 14-month high, stock market 14-month high, the central bank raises rates and the market rallies. Real estate value has gone UP this year down there. Businesses are increasingly confident, both domestic and export, and consumers are spending.

So, today's feature is Rio Tinto (RTP), an Australian miner that mines what the growing economies of the world (like China) wants.

This is a 3-year weekly chart. Talk about extreme. After hitting the 2008 summer commodity bubble high of $540, it lost almost 90% and hit the bottom in December 08 at $57. Since then, it has tripled in price but still nowhere near even the 38.2% retracement.

If the Australian economy is actually what they think it is down there (=robust growth) and the global financial markets don't crash again, however, Rio Tinto may have plenty of upside from here from technical point of view.

RSI is holding the trendline, and it's shaping into a symmetrical triangle or pennant ready to break either way. Same thing is happening in the stock price. A symmetrical triangle is usually a continuation pattern, and tends to break in the direction prior to the triangle. In this case, it's UP.

During the triangle formation, the weekly volume has been declining. That's usually a good sign. Slow stochastics set at 60,3 has backtested the 20 line and rebounded. Another good sign. CCI is still negative, but it is also holding the trendline from December.

If this pattern breaks out to the upside, the target price is somewhere near $300, 75% up from where it's at right now. If it should break to the downside, it will be back to $50s.

The rally that no one believed in back in March, April, May, June, July, August, and September still goes on. I'm sitting on my longs as none of my holdings has signaled a sell. I sold ABK as a housekeeping (of trimming the underperformers), but hasn't added new stocks for holding long. I just have options here and there, because from every corner I hear the calls for the market topping right here right now.

But I kind of like what I see in RTP as a long. I will see if it breaks out from the triangle/pennant, and if it backtests the trendline. Or I could buy right now, and put the stop at the upper trendline.

Despite the calls for the market top, a lot of stocks are setting up or are breaking out to the upside. They are almost too many to keep track of.

This is just my personal opinion and you should always do your own due dilligence, but it sure seems there are lots of opportunities to make money before the next collapse, unless it comes in very short order. (I could always use extra money to survive the catastrophe when it comes..)

Thursday, October 1, 2009

Be Careful Out There....Dow 5-Day Chart

looks absolutely wild. For two days in a row, Dow Jones Industrial Average, along with S&P500 and Nasdaq, went down in an above-average volume. Back to back distribution days.


This doesn't feel like a healthy consolidation, which you call when the index goes down modestly on a subdued volume. This is a high-volume dump. The 5-day 15-minute chart of Dow below does look like a whip-saw action you would see near a market top.

People who follow Elliott Wave Theory are gleefully calling the start of P3, a big down-leg which will undercut the low of the initial P1 down-leg.

On a one-year weekly chart, Dow almost touched (but never did) the 89-MA and turned back. It could be the start of a temporary but sizeable pull back, like the one we had from mid June to mid July, or it could indeed be the start of P3.

The stock market crash of 2008 started in earnest on October 1st, 2008. Dow kept dropping for 8 trading days straight. Just the friendly reminder.

Wednesday, September 30, 2009

Does It Exist In Nature? - Dow Intraday Chart


You can argue that since it happens in this world, of course it exists in nature.

But watching it intraday, it sure didn't look anything natural that you see in the stock market movement.

It's more like part of desert plateau in Utah... OK so it does exist in nature.


OT: Skimboarders on the Beach

This evening I took out-of-town visitors around the block to the bluff over a beach known locally to be a good one for boogie board. The wind was offshore but the ocean was calm, low tide, and there was no ridable swell; so there was no boogie boarders. As we all sat on the bench, looking over the bay, I noticed a skimboarder appeared. No ridable swell and break for the boogie boarders but since it was low tide, the waves were bouncing off the cliffs on either side of the cove and creating some intricate patterns. Offshore wind was getting stronger, too, adding to the complexity of the patterns.

The skimboarder, in his short wetsuit and looking no more than 15, 16-year old, was intently looking at the waves leaning on his board he set up vertically. He kicked the sand against the board, and waited. He waited for probably good 4 minutes before he finally picked up the board and started running, released the board, and running full-speed to land on the board to ride an intricate beach break for a very speedy, liquid run.

Soon, another skimboarder appeared. And another. Clearly, this particular break, offshore and low-tide, was good for skim boarding. I wanted to figure out how they decided to take off. What were they looking for?

So I started watching the first guy as he gazed across the wave patterns to pick his entry. After 3, 4 rides, I still couldn't figure out. I kept watching. Then he took off, running full-speed, on what looked like just a jumble of white waves dispersing. As he slid off the wet sand into the water, I suddenly saw it. He was riding the lateral wave off the cliff which was being formed underneath his board as a wave as he rode it across the cove!

I could be dead wrong as I don't do skimboard, but I think he was reading not the existing wave pattern but the wave pattern that didn't yet exist but could emerge AS HE RAN TO RIDE IT.

Since his reading was so good, that potential wave pattern would emerge just as he envisioned.

He and other skimboarders rode obvious waves as they broke, occasionally kicking the board high up in the air. But whenever they took off on no conspicuous wave break, the wave materialized under their board like magic, and carried them long and fast across the cove.

It's a keen observation and pattern recognition per excellence. And a split second decision to act on it.

And I kept thinking "He would make a great trader..."

Monday, September 28, 2009

Financials Are Still Lagging

Today, the U.S. stock market did some acrobat again. Overnight, Asian markets were obliterated (particularly Nikkei) partly because of stronger yen potentially hurting the recovery of Japanese exporters. But the U.S. market jumped on the news of M&A.

In the buoyant market with low volume, one sector seems still stuck in the range, and that's financials.

Here's the weekly 2-year chart of financial (unleveraged) ETF, XLF. From the top of May 2007 (financials topped way before the general market did in October-November 2007) to March 2009 low, it has yet to retrace up to 38.2% from the bottom, at $17.37 or over 15% from the current level ($15.08). The slow stochastics set at (60,3) to see the long-term trend is still below 50. CCI set at 233, again to see the long-term trend, is yet to go above -100.

I am still holding FAS that I bought back in March, when XLF was about $9. For XLF to go higher, it needs to hold the trendline, and at least cross over 89-MA - that's about $16.25. The next target would be the 38.2% retracement at $17.37. Around that area is very thin, so it could run up to the 50% retracement at $20.94 - that's close to 40% increase from here.

Well, that's a stretch. No way in hell it's going to reach that level. Or so it seems. But never say never. If XLF jumps 40%, that means FAS will jump 120% (in reality it would be less, maybe 100%). I wouldn't mind having FAS (I still have them) double from here...

But let me remind you this is just looking at the chart. If you read news, it sounds like this is the last sector you should be touching. So far I've been lucky. The technical levels that I'm watching hasn't been breached, and so far there is no reason to sell out longs (unless they are options, which I have a few).

(Why am I hosting the Kellog Raisin Bran ad? Thanks GoogleAds.)

Thursday, September 24, 2009

CNBC a Contrarian Indicator?

One headline at CNBC says "Buy-and-Hold Investing Makes A Return After Turbulent Year" (9/23/09).

Maybe it's time to take the profit from March low...

On the other hand, I hear a chatter that most professional traders have been short or getting short. With the high frequency trading it is very easy to create a stampede like we witnessed yesterday after the FOMC announcement. The market sold off very hard for 90 minutes to the close, non-stop. Certain things doesn't happen in nature, and that sell-off felt like one of those "unnatural" events.

Be careful out there.

Tuesday, September 22, 2009

BIDU's Pennants

Not as conspicuous or well-formed as AAPL's pennants, but Baidu (BIDU) also shows tradable pennants in the Point and Figure chart.

BIDU today breached $400 again intraday, and the stock is nearing all-time high that was recorded in 2007 ($429.19). It already passed the 2008 high of $382.90. If you look at the 3-year daily chart of BIDU, it looks just too wild to do anything with the stock. I briefly traded BIDU (2 days total) over BIDU's earnings using call options. Bought them before the earning, sold after the earnings, double the money, thank you.

But if you look at BIDU in the Point and Figure chart, there were several buy points that wouldn't have lost you money in the correction that came after. They were right at the pennant break. It may be forming another pennant right now, after hitting $408. It could correct back to the previous high, which is around $370.


Not that I am going to buy this stock. I don't know the company well enough, though TA people say it doesn't matter. Still, I don't have a good enough feel for the stock's movement. It already almost quadrupled in price since December 08 low, so the easier trade is probably over.

Sunday, September 20, 2009

Stock Market Analysis from HRA Advisories

I am not a "bull" when it comes to the stock market, even if I am still about 80% long (down from 90% a few weeks ago). I don't think this is a new bull market, I don't buy any of those "green shoots" that certain network TV (one that GE owns, for one) has been breathlessly talking about for the past 6 months.

But I found this commentary at Kitco's website. I thought I may share it.

Time to cash in? (September 2009, HRA Advisories)

The article title doesn't quite reflect the content, though. The authors are saying there are tons of trading opportunities in a current secular bear market, which they agree started in 2000 and we are probably half-way through it.

"We looked at the S&P during the last secular bear in the 1970’s for some insight on how far a bear market rally can go. The S&P chart for this period appears on the following page. As you can see the market basically “went nowhere” from 1968 to 1982, but that flat period included sustained rallies of 55%, 60% and 80%. A more recent example is the rally that occurred from 2003 to 2007. Bear market rally it may have been, but a 4-year 90% rally leaves room for a lot of profitable trading. One could refuse to trade during secular bear markets, that’s an individual choice, but it’s hard to make money sitting on the sidelines for 18 years.

"We’ve seen new bearish lectures about how the market has again gone nowhere for 15 years. True, if you do a straight line point to point measurement using carefully selected dates, but not very meaningful or useful."

Three Cheers (Pennants) for AAPL

I've been in Apple (AAPL) since the stock was $144. I don't use any of AAPL's products, can't afford Mac. I don't particularly adore Steve Jobs, although he has my sympathy for his illness. I'm not a fan of Apple, but I do like what AAPL has been doing in the stock market.

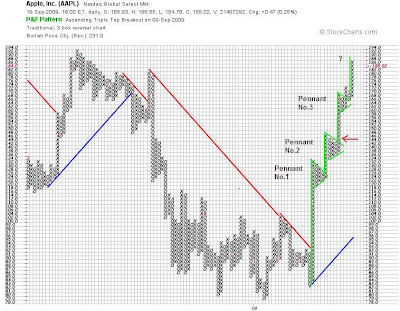
Here's a daily point and figure chart of AAPL. Notice the triangle pennant No.1 on a high pole. I commented in my posts back in May and June, but as usual I didn't act on it (it was right after the violent upswing of the market since March bottom). Then the stock made another pole and pennant (No.2). I bought AAPL during this second formation. (Timing was lousy, as I didn't follow my own advice of buying the pennant break. I bought before the pennant was formed, and which happened to be the same price as the pennant break. Oh well.)

Then, it formed another (irregular) pennant (No.3) and bolted up again. Translated into a regular candlestick chart, it would mean a strong upward movement followed by a brief quiet (low vol) period of consolidation, and then another strong upward movement followed by another period of consolidation.

It has done this burst/rest (or pole/pennant) pattern 3 times since the stock market March low (AAPL's low was in January, by the way). Currently it may be still doing the "pole" part of the 4th pattern. If you count each occasion as one base, it may still have one or two bases upward before it corrects again.


AAPL's 2008 high was $192.24 in May, and its all-time high of $202.96 was back in December 2007, right before the current market correction started. Remember January 2008, when the indices went down every single day for 3 weeks, paused, then continued going down in February? When all was done, AAPL's share price was almost cut in half. In the correction that started in May 2008 and ended for AAPL in January 2009, AAPL lost nearly 60%. Since then it has gained 137%. It's a wild chart if you look at it in a candlestick chart, looking too scary to touch it anywhere.

Friday, September 18, 2009

Dow 5-day Chart: Ascending Triangle?

It looks to me like "ascending triangle" formation over the two days. Usually the break is to the upside, but since today is a quad-witching day I don't think it will happen. But who knows? It's Mercury Retrograde, after all...


(If a breakout ever occurs out of this pattern (if this is an ascending triangle pattern, that is, LOL), the target for Dow is about 100 points up from here, bringing the index very close to 10,000. DISCLAIMER: I am not not qualified to advise, recommend on the stock market, and this is only for your and my entertainment.)

EOD (end of day), the crooks otherwise known as market makers and specialists, managed to end Dow Jones Industrial Average right on the dot on the lower ascending trendline. The ascending triangle formation is still intact, which may or may not be significant, as this was a quad-witching Op-Ex (option expiration) day.

Wednesday, September 16, 2009

Dow Jones Industrial September 16, 2009

It's about time I revisit the chart of Dow Jones Industrial Average. Why today? Because it's been over a month, and the index was up on a larger volume, and because my once-dessimated portfolio recovered to what it was right before the September-October crash of 2008.

In my August 3 post, I bragged "I Told You So in May, and Sucker's Rally Continues!". I'm not bragging again, but just wanted to mention what I got right almost for the first time since I started actively trading, almost exactly two years ago (right before the market top...). That's about psychology.

"To be really a "sucker's rally", the rally has to threaten to fill the huge gap down created in October 08", I wrote back in May. Whatever the underlying reason or un reason, the market has climbed just like I thought it might, handily beat my first target of 9,300 - 9,400. Right now, Dow is between the 32.8% retracement and 50% retracement from the October 07 market top.

In this Dow 3-year weekly chart, 50% retracement would take the index to about 10,300. That's the middle of the sheer cliff from October 08 crash; very thin resistance (remember those days when Dow dropped 200, 300, 500, 700 points in one day?). I wouldn't be surprised it runs up to 61.2% retracement, which would be around 11,200.

RSI is in uptrending channel, MACD is solidly positive, and slow stochastic is above 50 for the first time since the 2007 market top. It could collapse back so quickly if a next financial disaster hit, but for now they are all good signs, no negative divergence. Only negative divergence I see in the chart is the volume. It's been decreasing ever since the March 09 bottom while the index marches upward ("Rally that no one believes in"). However, the trend may change, as proverbial "performance anxiety" among professional traders, fund managers, and retail investors may intensify.

Tuesday, September 15, 2009

Cramer Believes in the Rally and Much More

CNBC's Mad Money host Jim Cramer just can't understand why people are so negative. He says the housing market is doing great, and will do well even without the government subsidy ($8000 first-time buyer credit), cash for clunkers was such a success. Retail is thriving, banks are solid.

So here it is, Jim Cramer on Mad Money Monday September 14, 2009, one year anniversary of Lehman Brothers bankruptcy which triggered... we know what, don't we?


I am still very much long the market, although I've started to trim my positions by selling partially. I don't believe in the rally when the government is spending like there's no tomorrow (there will be no tomorrow very soon at this rate), sucking up private capital from productive citizens and corporations. The stock market is not the economy, and I'm simply watching the technical parameters so that I can exit before @#$% hits the fan again. Ever since I went gradually long in mid March, the technical levels I'm watching are still not breached.

Monday, September 14, 2009

Rally Nobody Believes In Marches On

Just about every trader whose comment I read and hear wants to short the market or is already short. Then the market does what it does these days, which is to go up.

Quant/algo trading notwithstanding, today's intraday charts of all the major indices - Dow, S&P500, Nasdaq - registered a vertical spike all at the same time, at 2:27 PM EST. S&P Futures spiked at the same time. So far, there is no news that could have triggered it.

Certain patterns does not exist in nature, and this sure looks unnatural. You could possibly argue that the 30 minutes or so before the spike, the indices were sitting flat, getting ready for a pop.

Industrials and utilities supposed to pull the indices higher today. One of my watch list stocks, NOV, had a large volume up-day, ending the day above the overhead resistance of $40-41. I put in a partial order, which didn't fill. Might as well see if it can hold above today's close before I commit.

Tuesday, September 8, 2009

Gold Is Finally Breaking Out!!??

Today (9/8/09), Barrick Gold Corp. (ABX), the world biggest gold producer, announced that it plans to eliminate all of its gold hedges and raise $3 billion in a share offering to help pay for the move, as gold breached $1,000 mark. (AP News link is here.)

Barrick Gold will join Newmont Mining in having their gold positions totally unhedged. They clearly see a plenty of upside and little downside in gold, going forward.

Gold went up to $1007 today, only to reverse back to where it started the day at $995, making the daily candlestick "gravestone doji", a reversal signal. However, I'm not too worried about short-term reversal, because I continue to like what I see longer term. Gold has to correct over 25% from here to get to my cost basis (I have DGP, double-long gold ETN), and like Barrick Gold's CEO I just don't see it happening.

This is Gold continuous contract, 3-year weekly chart. I tend to see the huge reverse head and shoulders formation that has taken 18 months to form. On shorter time horizon (since March this year), I see "ascending triangle pattern". Both patterns share the same neckline. Short-term, a break from the "ascending triangle" would be around $1160 (widest distance in the pattern plus neckline). Longer-term, a break from the "head and shoulders" would be $1320 (head height plus neckline).

However, gold doesn't necessarily move based on technicals. China is calling back its physical gold holdings from London to store them in a newly constructed vault in Hong Kong. It recently allowed its citizens to own and trade physical gold, and is planning gold ETF based on their gold holdings. I suspect gold's huge jump last week was at least partly in response to the news from China. Gold has a potential to break even further up, beyond technicals.

Wednesday, September 2, 2009

Deep-Water Oil Rig Companies to Replace My DXO?

Deutsche Bank is closing out DXO, double-long oil ETN, thanks to the government's regulatory crackdown that is more likely to come sooner than later (margin requirement change, particularly on commodities trading). I had no intention of selling my DXO, and was planning to hold long-term as I see a long inflationary period (even if the economy is in doldrums) ahead.

But as of September 9 (some say it's September 12), I will have no choice but sell my shares back to Deutsche Bank (I think this bank is way extended in commodities markets - soft (ag), oil, and precious metals). Other leveraged long oil ETFs may have a similar risk of being shut down. The very fact that DXO is being shut down but not DTO (double-short oil ETN, also from Deutsche Bank) indicates to me (I could be very wrong, but) that the oil price is going to go up very soon. In order for DBank to create a synthetic double-long position (DXO) someone has to take the other side, and that someone is less and less willing to take that position, either because the oil price will go up soon and he will get royally squeezed, or the new margin requirement is just too much, or both.

So, I am forced to look for alternative plays without using leveraged ETF/ETNs if I think oil is still going up. For that matter, without using any ETF to be extremely safe. (Look what happened to UNG.)

I've started looking for oil-related stocks that are still forming a base. The first batch of such companies are oil rig companies:
  • Transocean (RIG)
  • National Oilwell Varco (NOV)
  • Pride International (PDE)
  • Oceaneering International (OII)
  • McDermott International (MDR)
RIG and PDE provides off-shore contract drilling and OII and MDR are engineering companies who coordinate off-shore oil rig operations. NOV manufactures actual hardware.

BP's newly discovered under-water oil field in Gulf of Mexico, the well was vertically dug 10,000 meters under 1,400 meters of water. It was a job by Transocean, and it is probably the deepest well ever dug in the world.

Anyway, here are the charts. I like RIG, NOV, and PDE, then OII and MDR.


Friday, August 28, 2009

Uncanny Resemblance: Dow Intraday vs One-Year Daily

It's possible I'm imagining things. Probable, even. But I just wanted to quickly share. The top chart is Dow Jones Industrial Average intraday for today (August 28, 2009). The bottom is also Dow, 11-month daily.

Fractal nature of patterns, or my hallucination, LOL.

Tuesday, August 25, 2009

GLD: No Particular Place To Go

but it had better move one way or the other pretty soon, as it is running out space to go.

I have DGP (gold double-long ETN), which I have since last year (I accumulated over several months). I can say two good things about my holding gold via this ETN: 1) it is up 15%; 2) it never dipped below my average price. Beyond that, it's been very frustrating, particularly when other commodity stocks that I own have gained at least 70% this year.

Let's look at the chart of GLD (chart pattern is the same as DGP, different scale). This is a 1-year daily chart. It looks like it is still forming a more or less symmetrical pennant, fast running out of space to run. Other technical indicators - RSI, stochastic - are also running out of space. MACD is flat-lining, and volume has decreased significantly.

A pennant formation is usually a continuation pattern, and tends to break in the direction before the pennant is formed. In the case of GLD, that direction is up. The target price of the pennant, I learned, is the length of the "flag pole" added to the place of the breakout; if it breaks out upward from $95, add the flag pole length of about $30, and you get $125. Should it break down from, say $92, then it could go below the November 08 low of $68.


Gold bugs decry manipulation by central banks and gold dealers (many of whom happen to be Treasury Primary Dealers also). I do understand their chagrin. On many days, spot gold price is high before the U.S. stock market opens, and as soon as the market opens the gold price is slammed down (like it happened today 8/26/09). Oh well. This is my "disaster insurance" holding which happens to take up 1/5 of my portfolio. I just have to make more money elsewhere...

Sunday, August 23, 2009

Rally That Nobody Believes In Continues

Weekend Tape Talk from Tickerville. Quint is a technical trader, and of course he says what he says: [fundamentals don't matter, because] "We continue to play the charts."


"People refuse to embrace this tape. And until they do the market is going to discourage them. When they capitulate, that is when we'll have to start to become concerned."

(Well, I've heard Q-man going short several times during the run from the March low and gotten squeezed out. Nobody is perfect.)

I took his stock trading camp (webinar) back in February 2008. The stock market was still iffy after (then-)miserable January. The webinar was mainly for the "future", when we could trade again from long positions. That future did come, after the Bear Stearns cataclysm in March, and my portfolio did recover almost back to 2007 high by June.

Then, after the stock market spending 3 months slowly descending, the real cataclysm hit in September. I do not think TA could have saved many investors/traders. You would have needed a macro perspective, not just economic but also political.

For now, TA for the long side is still working, and as long as it is working and the stocks that I've been holding (some of them since mid March) act well, I will keep the stocks and remain long. I'm keeping an eye on the emergency exit door, though.

Thursday, August 20, 2009

Crazy Little Thing Called AIG

AIG jumped 21% today after new CEO Robert Benmosche halted the auction of the firm's investment advisory unit and made some very aggressive statements in an interview on Bloomberg TV.

What did he say, you ask? According to Yahoo Tech Ticker,

"We believe we will be able to pay back the government and we hope we will be able to do something for our shareholders as well," Benmosche told Bloomberg TV in an interview from Croatia, where he owns a vacation home."

How the hell are they going to pay back $180 billion? But no matter. Here's AIG's daily 6-month chart. It strongly reminds me of the chart of Shanghai Stock Exchange Composite index, that I posted a few days ago.

AIG, as far as I know, is virtually broke (just like Fannie and Freddie, with Ginnie joining fast). Its price/volume action is probably 3 or more standard deviation away from the norm, i.e. it no longer reflect the underlying reality. I do see a negative divergence, twice. The last one led to a spectacular 2-month crash.

The trade here, if I were brave, would be to short the stock with the target below $14 and stop at today's high of $35, counting on the negative divergence to do the same work as before. But I am not brave, and this stock is pure casino.

By the way, the high of the day at exactly $35 makes me suspicious that it was a market maker's ramp-up job.

Wednesday, August 19, 2009

OT: Hitler Misses the Bull Market

It's hilarious. I don't think the original German is saying what the English subtitle is saying, but just hilarious.

We need humor to get through this stifling market going nowhere...

Monday, August 17, 2009

Free Fallin' in Shanghai

The Fast Money crew may be wishing they hadn't ridiculed Peter Schiff after Monday's beating in the U.S. stock market. Dow tumbled 186 points or 2%, to 9135, S&P 500 down 24 points or 2.43% to 979 ,and Nasdaq lost 54 points or 2.75% to 1930. The supposed reason was the worry about U.S. consumers not spending enough to lift the economy (as if that's anything new).

But I think the reason is overseas, in China. Take a look at this chart. It is a daily 10-months chart of Shanghai Stock Exchange Composite (SSEC) Index. After climbing over 80% from November 08 low, it looks to have topped on August 5. For two weeks, the index has been selling hard.

I don't usually follow Shanghai. I tend to use Hang Seng as China proxy. So I was rather shocked when I pulled up the chart for SSEC. It sure doesn't look like a chart of an orderly stock exchange. What's normally a support line on RSI was easily broken with no resistance. 50-DMA offered hardly any support. Right now it's in the middle of nowhere. If the next trendline offer a support, it will be somewhere between 2600 and 2650. Long-term slow stochastics (set at 60,3) shows it's quickly approaching 50.
The chart shows several trendlines from the bottom. Notice the angles of the trendlines got steeper and steeper as the index ran to the August top. I think it was a typical climax top, with very exaggerated movement at the top and abrupt turnaround to the downside on August 6.

Maybe this is the normal behavior of this index. I don't know, frankly. All I know is that the current crash started when the Chinese central bank indicated it would "fine-tune" the monetary policy. The market clearly took it as tightening of credit, and quickly headed south.

Today, after falling 1.5% in the morning session there (Tuesday August 18), it is reversing and trying to go into a positive territory. It may finally indicate a trend reversal, by forming a doji candlestick. But with a wild market like that, it may just take a dump at the close. Who knows?

The U.S. market participants seem to think the key to the continued "recovery" (at least in the stock market) is China. (I personally think the key to the recovery here is here, the U.S.; if the U.S. doesn't buy, what could China do?)

Saturday, August 15, 2009

Fast Money Crew Laugh at Peter Schiff

for being negative on the U.S. stock market and the government/Federal Reserve policy.

Huh?

Peter Schiff appeared in a segment in CNBC's Fast Money on August 12. I used to watch this show, but finally stopped doing so in disgust when they simply kept peddling stocks as the stock market crashed around them. I heard the host Dylan Ratigan departed since then, and Jeff Macke is no longer there. But I didn't know the extent of deterioration of the show until I saw this segment, which was posted by a member in the Yahoo SKF message board.


Let's see... The last trade I remember Joe Terranova (who was yelling at Schiff in the interview) said he did was to sell a straddle on oil around $100. He thought the price of oil is not going anywhere anytime soon, so selling the straddle and letting both sides (call and put) decay was a good strategy, he said. WRONG. The price of oil crashed from $110 to $35 in 3 months. The last trade I remember Karen Finerman (to whom the show's host turned right after she dismissed Peter Schiff and whispered "What do you think of Peter Schiffs 'ahhrrgument'?" with a strange look) said she did was to buy Washington Mutual, "a good brand name, with lots of upside potential", right before the company was seized by FDIC. The stock trades at about 10 cents these days, in pink sheet.

Other two are no better. I remember Guy Adami pushing SLB (Schlumberger) all the way down, Pete Najarian pushing on Nat City as a takeover target (the bank was taken "under" - i.e. at far less price).

What can you expect from a station owned by General Electric, who has been rescued by the U.S. government TARP money?

And they have the audacity to ridicule Peter Schiff. That's hilarious. The stock market may indeed be topping, because the last time money and stock market programs in cable television stations openly laughed at Peter Schiff was right before the start of the recession/depression we are currently in.

Peter Schiff may be wrong in short term trends in the U.S. dollar or stock market, but he's been right on on intermediate and long term picture. It literally pays to listen to him, not the Fast Money crew (unless your goal is to lose money for tax purposes).

Just my humble opinion, from my own limited experience.

Wednesday, August 12, 2009

Baltic Dry Index Worst Since October Meltdown

So says the headline of the article in Telegraph U.K.

Baltic Dry Index has worst week since October meltdown as Chinese demand slows (8/8/09 Telegraph U.K.) [emphasis is mine]

"The Baltic Dry Index, which tracks shipping costs and is viewed as leading indicator for commodity prices, has had its worst week since the peak of the financial crisis last October, as Chinese demand slowed.

"The index fell from 3,350 to 2,772 this week – a fall of 17.2pc - as imports of iron ore and coal slowed down. The index is now 35pc lower than its 2009 high, hit on June 3.

"Earlier this week Ian Ashby, head of iron ore at miner BHP Billiton, said at the Diggers & Dealers conference in Australia that Chinese restocking of iron ore was at an end.

"Mr Ashby said that supplies at the country's ports were enough to sustain a month of consumption.

"However, some believe that imports have slowed down as Chinese steel mills are still locked in talks over the pricing of iron ore imports over the next 12 months."

Hmmm.. I still have MTL, a Russian iron ore company, which seems to be stalling at $12. It passed that point in June, only to head back down, and back up again and headed back again in early August. I still don't see anything technical wrong with the stock, but with the macro information like Baltic Dry Index and Chinese hoarding to end, I'd better be careful, and not be too greedy.

Monday, August 10, 2009

Freddie Mac's Craziest 5 Days

Those of you who held on to FRE (and FNM to an extent) despite a dump on Friday, congratulations again.

FRE (Freddie Mac) had the most violent 5 trading-days since it was virtually nationalized in September last year. Monday's jump was due to the earning report AH on Friday last week (FRE made profit, for a change), but the stock kept going up AH Monday and ended at $1.81, 200% up (or triple) from Tuesday last week.


Freddie and sister Fannie are practically bankrupt. And yes, there's an encouraging (I suppose) talk of setting up an entity to absorb Freddie and Fannie's bad assets. But this is just a talk at this point. I have no idea where FRE or FNM will go from here. Their longer-term charts don't mean much, because, as I have just said, they are practically bankrupt and technical analysis means nothing.

Retail investors who are holding FRE and/or FNM are irrationally and extremely bullish, saying their stocks will go to $5. That sounds wild, but FRE was indeed $5 one year ago.