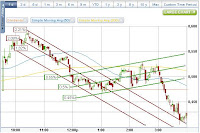
Haven't seen that kind of sell-off for some time. The final hour was nothing but selling, which drove Dow from 8,521 all the way down to 8,406 (ended off the low). So far, I can't find any news that could have triggered this. Today's point swing is 185 pts from the top to the bottom. It must have taken out lots of stops...
Trading volume was higher than yesterday. Another bad sign for market bulls.
-------------------------------------------------
(11:36am PST Update)
 Now the channel has changed to a slight upward one, with a few burst of severe sellings as you can see in this 3 minute chart.
It sort of feels like a topping action...
--------------------------------------------------
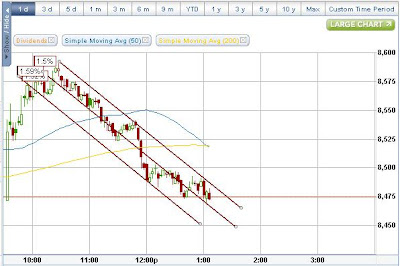
Dow Jones Industrial Average is trading within a severe downward channel for more than 2 hours, ever since, I was told, the Q&A started in today's Senate Hearing and the Treasury Secretary started to fumble for words (I don't know that, I wasn't watching, I'm just reporting what I heard). (Ignore the percentage tags on the chart. I can't get rid of them..)

Some numbers to watch:
- On a daily chart, the mid Bollinger band is somewhere near 8,310 so there's still some way to go if the index is to correct to that point.
- May high for the index is 8,588.
- May low is 8,230.
- And that May low is not very far from February high (8,312) before it all started to crater.
- Simple 50-DMA is about 8,000. I would start to worry if it starts to threaten this line.


No comments:
Post a Comment