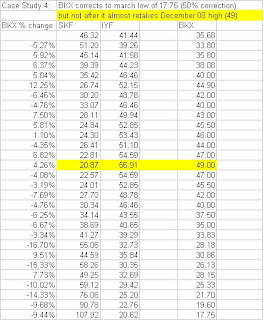
I made this spreadsheet back when there was still a lot of talk of imminent market correction and retesting of March low. BKX is the Philadelphia Bank Index. SKF is Ultrashort Financials ETF (double short), and IYF is unleveraged long financials ETF. For BKX to go from May 22 level to March low of about $17, that's 50% correction. As a double short ETF, SKF should at least go up 100%.
I said "should", because, in real market, the index does not drop 50% in one day. So I created 4 case studies:
- BKX will drop 10% every trading day until it hits March low;
- BKX will drop to March low but go down in a zig zag;
- BKX will drop to March low but not before it goes back up to May high and touches 200-DMA;
- BKX will drop to March low but not before it almost retakes December high.
After observing the market action and BKX since then, I just added one more case, not a very good one for the market bears and SKF bulls:
- BKX will hold at this level, and go up in zig zag, taking out prior levels, all the way up to September-October 08 level.
Case study 2: BKX will drop to March low but go down in a zig zag:
Case study 3: BKX will drop to March low but not before it goes back up to May high and touches 200-DMA:
Case study 4: BKX will drop to March low but not before it almost retakes December high:
Case study 5: BKX will hold at this level, and go up in zig zag, taking out prior levels, all the way up to September-October 08 level:
Last September, SKF was trading above $100.
Today, SKF is trading slightly below $40, with one hour of trading left. IYF is around $44. BKX is at 37.76.
I am totally out of leveraged short ETFs for now. I have a feeling that BKX could run back to December high (around $46). It is tempting to short SKF, or buy puts, with the target price of $25.


No comments:
Post a Comment