Sunday, November 29, 2009

Limitation of Technical Analysis

Tickerville's Quint Tatro (whom I took a webinar on TA from, and whom I've been using as one of my contra-indicators since April this year - sorry Quint) continues to be bearish.

He starts this Tape Talk, talking about how Friday's 3.5 hour market had a significant volume distribution, without even mentioning Dubai.

Tape Talk (11/29/09)

I'm wondering if this should be the last time that I even link to his analysis... (If you are his fan, make sure you bookmark his site.)

Without macro (financial, economic, political, even social) understanding (or at least an attempt), the investment/trading becomes reactive to the events (like Dubai) as they unfold, and technical analysis becomes justification after the fact.

Now the guys at Breakpointtrades.com, from which I receive free TA newsletters sent out Early Friday alert after Dubai debt crisis caused the U.S. stock market futures into deep red like it were September 2008 all over again. The alert arrived in my Inbox at 3:01AM PST on Friday, with 43 charts no less, so that we would be prepared mentally for a potential big gap down. They are also technical traders, but they seem to put TA in bigger context.

Early Friday Morning Market Newsletter Special Edition (11/27/09 Breakpointtrades.com)

I trimmed my holdings somewhat on Friday, but more of a housekeeping and not a panic selling. It was a gap down alright, but the indices went nowhere near what I was prepared for (at least not yet, it could still happen), and a peek into the Breakpointtrades.com guys' charts helped calm the nerve. (Disclosure: I'm not paid to recommend their site or their service.)

Thursday, November 26, 2009

Batten Down the Hatches, Probably...

Thank you Dubai for the Thanksgiving surprise!

This is one of those events that defy technical analysis. You can't predict the event like this by looking at the chart. Asian markets are having a second day of severe down draught, with Hang Seng and Seol Composit leading the way. European bourses are sure to follow, which will be followed by the U.S. market. Dow futures are down 250 points as of 00:16 AM EST. I don't remember seeing the Dow futures this much in deep negative territory even in September/October of 2008.

The chart below is a 2-year Dow weekly chart, just to show the Fibonacci retracement from the March bottom to November top to see how low the index could fall. 61.8% line seems to offer a solid support, which is around 8,960. Back to the level in July. In between, 10,000 and 9,500 have some support, as they were resistance on the way up.


One of many things I regret for not having paid attention is Dubai's world-tallest skyscraper. When that building (still under construction) became the tallest in the world, it was September 1st, 2008. Right before everything went to hell in the stock markets worldwide. I had read about the "skyscraper index" back in January 2008, but I didn't connect.

It would be ironic if another Dubai incident (this time a threat of sovereign default) marks the beginning of a significant leg down in the market, which Elliott Wave people call P3, last leg of a bear market which will undercut the first leg low.

Tuesday, November 24, 2009

Dow Jones Intraday and Linear Regression

This is today's Dow Jones Industrial intraday. I was just watching the market today, mostly, and this is what I was watching: linear regression line.

I plotted the top line connecting the peaks, more or less, and the bottom line connecting the bottoms, more or less. I decided to ignore the spike down after 10:00 AM PST as reactionary low. I drew the center line right about the middle. And after 3:00 PM EST I thought, well I think they are going to park Dow right about 10,434. Sure enough, Dow ended the day at 10,433.

I've noticed that the Fibonacci retracement numbers and linear regression work better these days. Just my feeling. It could be because of those algo computers are programmed with numbers. I would be impressed if they are programmed to recognize patterns like "cup and handle"...

Saturday, November 21, 2009

Nikkei and Dow, Since 1984

Japan's Nikkei must be the saddest stock index in the world. At least so it seems to me.

Nikkei is again (third time) lower than the level in 1984, and that's 25 years ago. "A lost decade"? Here we may be potentially talking about "lost three decades", and possibly hoping that it will stop at "three decades".

Sunday, November 15, 2009

Japan's Nikkei Looks Sick

When Dow, All Ordinary, Hang Seng, BSE, just about every major index in the world jumped after the full moon in early September, Nikkei didn't join the party. It ended the month down. After the sharp correction worldwide in the second half of October, the indices are off to the races again after November full moon. Except Nikkei.


According to Bloomberg, currency traders are increasingly bearish on Japanese yen and betting against it, predicting 10% or more fall from the current level (around 90 yen/dollar). The new government (Democratic Party of Japan) is still learning its way in and around the system, but more government spending and falling tax revenue with a shrinking population doesn't augur well for their misguided efforts.

FXY is the Japanese yen ETF. EWJ is the ETF that tracks stocks on Tokyo Stock Exchange. You can short the ETFs, or buy put options on them if you share the bearish sentiment about the world's second largest economy.

Friday, November 13, 2009

Nasdaq Betas That Don't Come Back Down

With just about every analysts eager to call the top, the market marches on, bid or no bid. My portfolio has been rather stagnant for 2 months, with gains in precious metal stocks offsetting the weakness in financials. Probably a top is near, therefore, but I don't think the market will crash back to, say Dow 6,000, right away as some of them proclaim.

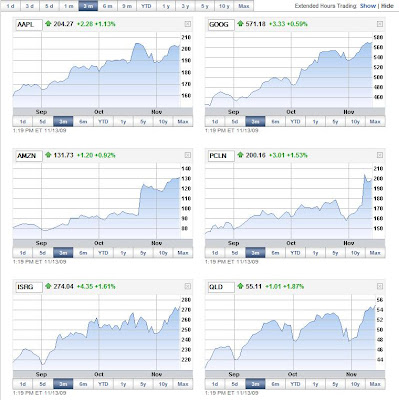
Why? Nasdaq "beta" stocks: AAPL, AMZN, GOOG, ISRG, PCLN.

They refuse so far to correct much. AAPL corrected the most after earning and filled the gap. But others, particularly AMZN and ISRG, hardly looked back, and has since resumed the upward march.


How much upside could there be for the major indices? Another 10%? 5%? I am debating whether it is worth to stay in the market, but when I look at these Nasdaq tech stocks it is tempting to believe this is a new bull market, in which you would buy stocks on the breakout from the high.

Thursday, November 12, 2009

NYSE Summation Index (Cumulative) Still Bullish

It's not the kind of index you hear or see very often. This is one of the charts that the guys at Breakpointtrade.com use for the market's bigger trend. (I am signed up to receive their bi-weekly newsletter. These guys are good.)

I recreated it using Stockcharts.com. As you can see, it gave a buy signal at the end of March. It didn't pick the bottom precisely, but really very good enough signal to get in. Ever since, the index (cumulative) remains up-trend, and CCI set at 13 hasn't dipped below 100, i.e. no need to sell my long positions in a hurry, yet. S&P 500, which is plotted at the bottom of the chart, still manages to maintain the uptrend line since March. If you are not so much concerned about day to day fluctuation, this summation index gives a pretty good signal.


If you use it, make sure you plot the chart as "cumulative".

For those of you who want to know what the heck is the "summation" chart, here's the explanation from Stockcharts.com.

Tuesday, November 10, 2009

Beaver Moon Did It Again...

The U.S. stock market bounced on the full moon (Beaver Moon), yet again. Just when I started uneasy holding long positions after seeing high-volume selloffs (that clearly signal distribution - pros are getting out).

This moon cycle pattern was first mentioned back in September by one of the members (a very strange one, too) on the Yahoo SKF message board. I laughed, but I didn't sell out, partly because of his insistent comments. Another bounce occurred on October's full moon. And another on November's full moon, which has now sent Dow to 2009 high. This latest full moon, I learned, was considered the most powerful full moon in 100 years, according to this Indian guru. (The link was given to me by my primary physician.)


This is a daily Dow chart, marked with green arrows for full moons, and red arrows for new moons.

Please don't trade on the moon cycle unless you do your own DD (I don't know how you do DD on moon cycle but...) and are convinced of it. I am definitely not recommending anything here. It's lunatic, literally. And MACD and RSI both show negative divergence, although slow stochastics (60,3) is nicely above 80 again.

Negative divergence on a short-term daily chart usually indicate a correction is imminent, and I thought we would get that correction today. All we got was S&P500 down 0.07 points and Nasdaq down 2.98 points. Instead of selling off, Dow managed to go positive. What do I know? (Can't win against Goldman Sachs, who's doing "the God's work", can we?)

Wednesday, November 4, 2009

Expanding Wedges on VIX

I've read that an expanding wedge pattern near the top after a prolonged upward movement is bearish, a topping pattern.

What about an expanding wedge near the bottom, after prolonged downward movement? Is it bullish? Bearish? Anyone?

Because that seems to be what I'm seeing in the VIX daily chart. Not just the index movement, but also RSI, MACD, and slow stochastics (12,3).