Friday, July 30, 2010

Well, Hello Fractals.... Dow 3-Year Chart Now and Then (2008, 2009)

So the 2nd quarter GDP comes in lower than expected, but the obligatory dive of the stock market at the open was quickly eradicated. Dow Jones Industrial Average is down only about 10 points, instead of 100 points. For now, at least (9:30 AM PST).

Nothing to trade here, so I started my game of pattern recognition in the 3-year Dow daily chart. And I'm seeing something interesting. I'm not claiming it definitely, but I'm just sharing.

I see a pattern from October 2008 to June 2009 being repeated, albeit on a smaller scale and shorter time frame: diminution.


We know what happened after April 2009. It seems like QE2 in some form is all but guaranteed. Are we going to have another melt-up on low volume, going into the November election?

But you may also notice that the current pattern looks very similar to the pattern right after the market top, from December 2007 to April 2008. We know what happened after that. The stock market went up in April and May, making TA people giddy with the idea that the chart is forming a big "cup and handle" pattern and that the upside would be so great when that pattern breaks to the upside. And then June came, and it was all downhill from there...


So, take your pick. Or don't pick at all and join people who have been yanking their money from the equity mutual funds.

The Cardinal Climax is coming. Just so you know.

Thursday, July 29, 2010

CBOE's Weeklys on ETFs and Stocks May Be Causing a Range-Bound Market Since June?

Just so you know, too. (I didn't know. H/T liveup)

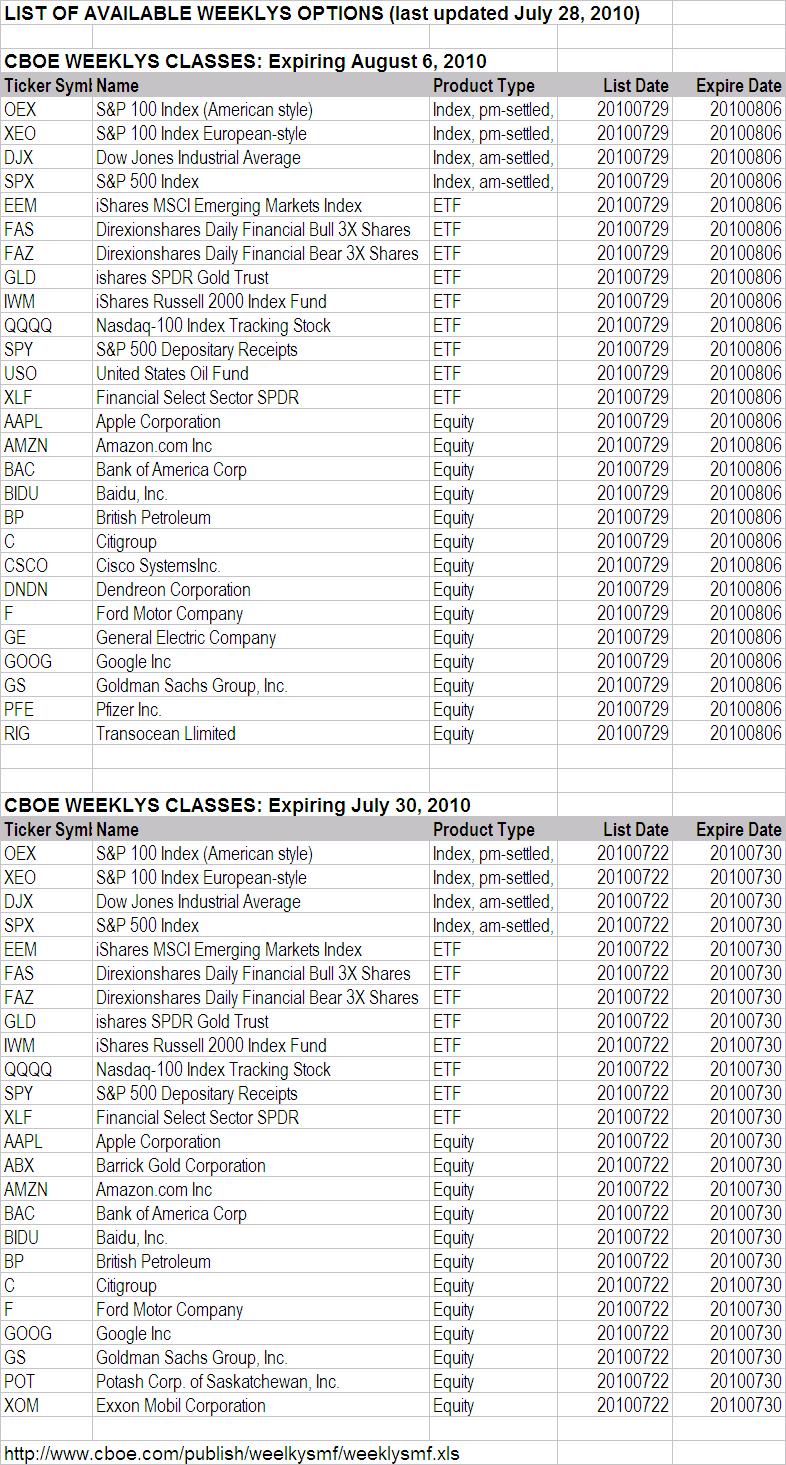
If you trade any of these ETFs and stocks, be aware that they have weekly options (Weeklys) traded on them on top of regular options, courtesy of CBOE (Chicago Board of Options Exchange), that expire every Friday. In case you're wondering why Apple (AAPL) gets hit back to $260 for several weeks, this may be your answer. CBOE has had Weeklys on the indices (S&P 500 and Dow, both American style and European style) since 2005, but the introduction of Weeklys on ETFs and select stocks is a recent event (since June 4, 2010).

ETFs:
SPY (since June 4, 2010)
QQQQ (since June 4, 2010)
DIA (since June 4, 2010)
IWM (since June 4, 2010)
EEM (since July 5, 2010)
USO (since July 5, 2010)
GLD (since July 5, 2010)
XLF (since July 5, 2010)

Stocks:
AAPL (Apple; since June 25, 2010)
BAC (Bank of America; since June 25, 2010)
BP (BP; since June 25, 2010)
C (Citigroup; since June 25, 2010)
F (Ford; since July 5, 2010)
GOOG (Google; since July 5, 2010)

What's more, the individual stocks that will have Weeklys on them seem to vary from week to week. Here's the latest indices, ETFs, and stocks that have Weeklys (table downloaded from CBOE):

(Click on the chart for a better view. If the image doesn't load fast enough, go here and download: http://www.cboe.com/publish/weelkysmf/weeklysmf.xls)

Note to FAS/FAZ traders: They've been range-bound for a reason...

Tuesday, July 27, 2010

Amazon Runs Out of Kindles

(Update 7/28/2010) So RIMM has popped on the news of iPhone killer. I'm not impressed with the move, at least not yet. The stock is yet to take out yesterday's high, which is $55.65. AMZN continues to languish, going nowhere.

-------------------------------

so reports Barron's Tech Trader Daily by Eric Savitz on July 27, 2010. Maybe that's why the stock had a miraculous reversal the day after the earning announcement:

(Quote)
Amazon.com (AMZN) has temporarily run out of Kindles.

Here’s what it says if you attempt to buy the e-Book reader on the company’s Web site:

“Temporarily out of stock. Order now and we’ll deliver when available. We’ll e-mail you with an estimated delivery date as soon as we have more information. Your account will only be charged when we ship the item.”

And what do you see when you go to the Amazon home page? Why, a promo for the extra-big Kindle DX!

As SlashGear notes, the sudden Kindle shortage could mean there has been a surge in demand - or it could mean a next-gen Kindle is on the way.
(Unquote)


That sudden reversal after the earning report has kept my AMZN puts worthless, but I still don't think much of the AMZN chart. Ever since the July top of $124.88 it's on the decline, underperforming the index (Nasdaq). You could say it is resilient, refusing to sell off. But it looks to me like it wants to sell off at any time now. (Of course I'm biased, I have AMZN puts.)

This stock and another Nasdaq beta Research in Motion (RIMM) look to me to be ready to dump. But then the Kindle rumor may be true, and RIMM just announced the iPhone "killer". They may turn on the dime.

Monday, July 26, 2010

AAPL's Peculiar Candlestick Pattern

(UPDATE 7/27/10) So it has popped, for now. Still over 1 hour left in trading. It is yet to take out the Wednesday high of $265.15 to be a textbook "Rising Three Method". The market is iffy, almost scared, after bad news on consumer confidence. Maybe I'll book my gain on August $280 calls...

----------------------------------------

Apple (AAPL) is forming an interesting candlestick pattern. I think it is either "Falling Three Method" or "Rising Three Method". I know I know they are total opposite, but I can't decide. So I let you see the chart.

Here's AAPL's 5-month daily chart. Since late April, the stock hasn't gone anywhere. Except for the flash crash on May 6, it has been range-bound. That itself is interesting, as this is one of the most favorite stocks of algo bots - big cap, high volume, high beta.


Here's the explanation of "Falling Three Method" from Stockcharts.com's Chart School Candlestick Pattern Dictionary:

A bearish continuation pattern. A long black body is followed by three small body days, each fully contained within the range of the high and low of the first day. The fifth day closes at a new low.

And "Rising Three Method":

A bullish continuation pattern in which a long white body is followed by three small body days, each fully contained within the range of the high and low of the first day. The fifth day closes at a new high.

The problem I have in determining the pattern is that the first day (Wednesday last week) was an up day but it was a gap up and sold off all day with the market. That doesn't feel bullish. But then, either pattern is a continuation pattern, and Tuesday was a huge up day.

So, cautiously, I am inclined to say it may be a "Rising Three Method" pattern, which means AAPL will go up tomorrow.

The stock futures are currently down. TA people are calling for a "consolidation" after three consecutive up days.

Well, the major indices registered a pattern called "Three White Soldiers", which is a bullish reversal pattern.

There was a sizeable volume (13,494) on AAPL August $280 call option (OE 36,273).

But the algo bots will do whatever they want to do, and the market can melt up or down on a thin summer volume. GLTA.

Tuesday, July 20, 2010

Large Caps on Turnaround Tuesday Look the Same

I am noticing today that stocks in totally different industries are exhibiting the same pattern on a daily chart. All very bullish candlestick formation (long white candle with hardly any wick), outperforming the general market.

Here are the 6-month daily charts for (from the top):

Las Vegas Sand (LVS)
Nucor (NUE)
Google (GOOG)
Freeport-McMoran (FCX)
J.P.Morgan Chase (JPM)


Don't know what to make of them at this point, other than my guess that algo-bots are simply working the ETFs and index futures so the heavily traded large caps all move the same way regardless of industry or fundamentals.

But even with today's move, these stocks, with the exception of LVS, are either still below 50-DMA or barely touching, or crossing 50-DMA but 200-DMA is still far away. It will take a lot more consolidation to repair the damage.

I personally like LVS (not on the 6-month chart but on the longer charts like 3-year). It was a steal at $1.30 or so in early 2009. It could go up the thin vertical wall that was October 2008 and reach $30. I just don't know when or how. (Casinos in Singapore and Macau, maybe.)

"Turnaround Tuesday" delivered a turnaround. Let's see if they (bots and bots operators) intend to hold it. The Fed chairman Ben S. Bernanke will be testifying in the Congress on Wednesday and Thursday. It could affect the stock market.

Tuesday, July 13, 2010

FAS - Mind the Gap

What a difference a week makes. Before the Independence Day the world was going to end in ruin. After, all the troubles are gone, at least from the US stock market. Fundamentals be damned, they don't change from week to week! What a bore!

As algo bots busily and dutifully working every microsecond of the day (and night) with the self-sameness, the humans that still inhabit the financial media outlets are doing their best to craft a narrative depending on the market direction of the day (sometimes of the hour), which has little to do with the reality on Main Street.

Since these bots like beta and leverage, IF they are planning to ramp up the market even further (until the Cardinal Climax hits), what better tool to hitch that ride than a triple-long ETF?

Here's a daily 9 month chart of FAS, triple-long financial ETF. The candlestick chart looks like a crap, full of gaps. Who in the sane mind wants to trade this? Or for that matter, any stock in this market?


Since the bots seems to like Fibonacci retracement numbers, I put in two sets of Fibs: one from May high to July low, the other from April high to July low. Today, it passed the 38.2% retracement to May high.

The biggest gaping gap exists between 50% and 61.8% retracement to April high. If this gap is filled, FAS will be about $31. It closed today at $23.57.

Now, is there any hint on the technical indicators that supports this bullish scenario? In fact there is. More than one. First is MACD. Notice the positive divergence developing. The second is ultra-slow stochastics (89), which just crossed above 20. If this stays above 20, it may be a buy signal.

The buy signal may be short-lived, though. J.P.Morgan Chase (JPM) will report its earnings during Thursday premarket, Bank of America (BAC) and Citigroup (C) during Friday premarket. In previous two earnings, JPM was sold hard despite beating the estimates.

If you got FAS, maybe it's safe to sell tomorrow and avoid the heart attack waiting for JPM to report on Thursday morning.

Oh I forgot. Fundamentals don't matter.

Algo bots have their own minds. As I wrote on the chart, if the chart is somehow plotted in 3D with data that is not represented in this 2D chart (data like each individual trade size and price done by the bots), it may become a beautiful Lorenz attractor and it may all make sense.

Sunday, July 4, 2010

S&P 500: Another Death Cross Imminent?

S&P 500 Index had a "death cross" (a very, very slight one) on the daily chart on Friday, where 50-day Simple Moving Average crosses below 200-day Simple Moving Average.

The index is about to have another death cross on the weekly chart. On the weekly chart, I look at two Exponential Moving Averages (13-EMA and 35-EMA) to see whether they are crossing, or 40-week Simple Moving Average to see if the index crosses below it.

Here's 3-year weekly chart of S&P. 13-EMA and 35-EMA is about to cross: less than 3 point. As you can see, 13-EMA crossing below 35-EMA in December 2007 was a pretty good indicator of a major directional change of the market. 13-EMA stayed below 35-EMA all the way till July 2009. 13-EMA/35-EMA pair does not call the market bottom, but rather it seems to indicate the safer point to go long, as in July 2009. Now 13-EMA may be crossing down again for the first time since December 2007.


I also use 40-week Simple Moving Average on weekly. As you can see, this one spotted the turn in the market a few weeks earlier than 13-EMA/35-EMA cross. Week before last, the index decidedly broke below 40-MA, and it couldn't regain that line this week.

End of the "bull market", as many pundits and analysts are saying?

I don't think so. I'm in the Peter Schiff's camp in thinking that this has been a Federal Reserve and government stimulus-induced counter-trend bull run within the bear market and the run is now ending. Elliott Wavers would say P3 has finally arrived. (The only problem is that they have been calling P3 at every downturn in the market since March 2009.)

Some technical indicators, which, along with 13-EMA/35-EMA cross, I picked up from BreakPointTrades.com guys, also show that the market was never in a bull market. They are all flashing a sell signal. Slow stochastics set at really, really slow (144) shows that the indicator never went to oversold territory in the whole "bull run" from March 2009. Notice that at the market top in October 2007 it was in the oversold territory of above 80.

CCI set at 133 also shows that the market was not in a bull market (above 100). It went nowhere remotely near 100 since March 09. In a bull market, this indicator stays mostly above 100.

Along with another long-term indicator NYSE Summation Index (Cumulative) that also turned bearish in late May, these special technical indicators and moving averages give me some sense of peace of mind, knowing that the things are about to get dicey...

Be safe.

Wednesday, June 30, 2010

Dow 5-Day 15 Minute Chart


Not much space left to go anywhere. It's got to resolve one way or the other. The last triangle pattern broke badly to the downside just yesterday.

Tuesday, June 29, 2010

End of the Bull Market?

says Fibozachi.com.

Good analysis. Particularly after today's rout.

Did you know that there was only one stock in S&P 500 Index ended in green today? Zero in Dow Jones Industrial Average, and only 1 in Nasdaq 100?


Did you know that such an extreme number on S&P last happened in September 29, 2008, right before the cascading market crash in October 2008?


End of the Bull: Primary Trend Shifts as Markets Shatter
(6/29/2010 via Zero Hedge)

"While technical analysts and traders have numerous techniques for determining trends, the most basic method is the tracking of higher highs and higher lows (bullish trends), or lower highs and lower lows (bearish trends). Tuesday's relentless sell-off across US equity markets marked an undeniable end to the continuous series of higher lows that had been intact since July 2009. With Tuesday's close below 1,044.50 on the S&P 500 Cash, 'bulltards' can no longer claim that the primary trend of equities remains bullish.

"Traders are going to have their work cut out for them in the days and weeks ahead as a plethora of support levels remain scattered between the levels of 950 - 1,030. Though equities appear poised for downside acceleration into Q3, remaining short may prove difficult in days ahead for most as increased volatility, erratic HFT algos and near-record market internal readings combine to create yo-yo-like equity markets. Tuesday's Advance / Decline line for the S&P 500 clocked in at -498, with only Zimmer Holdings (ZMH) closing higher. As a company that designs, develops, manufactures and markets orthopaedic reconstructive implants, dental implants, spinal implants, trauma products and related surgical products ... could GETCO be anticipating a large order from Mr. Market for a new hip?

"Joking aside, what can we expect after such an all-encompassing technical rout? There are essentially two ways to interpret such overwhelmingly positive / negative market internal readings: temporary exhaustion and inflection or breakaway continuation. Normally, when US equity markets exhibit an opening dislocation (greater than +/- 1.5%) and an extreme trend day (greater than 90% A/D, VOLD, etc.) there tends to be an immediate reflex so as to offset lopsided internal measures of momentum. And though the majority of such dislocationary instances immediately resolve themselves in the opposite price direction, the possibility of witnessing a breakaway continuation to the downside here looms large. [Emphasis is mine.]

"The only other modern instance of a -498 Advance / Decline reading on the S&P 500 occurred on September 29, 2008."

The article continues, and it has several charts (including the one I linked above) that illustrate this was no ordinary down day.

Their recommendation for traders? Sit on your hands for a day or two, to see if any set up presents itself.

This gotta bounce tomorrow, at least some, and the stock futures are in green right now (Dow futures up 31 points, S&P futures up 3.70 points).

Since all that matters seems to be Fibonacci retracement numbers, here are numbers to watch if the market does bounce tomorrow:

Dow
38.2%: 9,935
50%: 9,973
61.8%: 10,011

S&P
38.2%: 1,048
50%: 1,053
61.8%: 1,057

Just keep in mind what Fibozachi.com says above, that it may be a "breakaway continuation" to the downside. That means without hardly any dead-cat bounce.

Batten down the hatches, I'd say.

AMZN: Make or Break (with Updates)

(2ND UPDATE 6/29/2010) The stock ended at $108.61, and it was as low as $106.01. Let's see if It tries to regain $110 tomorrow. If it tries and fails... look out below... to 200-MA on weekly at $78, which happens to be just about the target for the head and shoulders pattern...

(UPDATE 6/29/2010) And it broke! Watch if it stops around $110 and bounces. Slight positive divergence on RSI is gone now. If it does bounce but if it's a weak bounce (price, volume), filling the gap down to $80 may be coming soon....

-------------------------------------------------------------

Amazon (AMZN) may be getting ready for a plunge, unless it manages to rebound right here right now.

Here's is AMZN's daily 1 year chart. After gapping up in late October above $110, it has managed to stay above that. But in the process, the volume has dwindled, and the pattern looks like a big head and shoulders (bearish), with the tiny right shoulder shaping like a descending triangle (bearish).


If the plunge happens, it is likely to fill the gap and settle between $80 and $90. Height of the head from the neckline (say $115) is 36. Neckline minus 36 will give you the target of $79, but I do see some support above $90. Also, technical indicators are not totally bearish, except for slow stochastics set at 89. It's already in a bearish territory of below 20. There's a positive divergence between the stochastics and MACD, but that divergence could be blown away if the tentative general market decides to go down.

AMZN will report its earnings on July 23. The stock tends to move significantly on earnings. August put option at $100, traded today for $2.69, could be worth $20 if AMZN plunges to my target... [Please do your own DD. This is not advice in any way...]

Thursday, June 17, 2010

Gold Ready to Break Out

from the ascending triangle pattern which formed a 2-month "handle" to the 5-month cup.

J.P.Morgan Chase could only do so much. Gold is the true money.

Tuesday, June 15, 2010

Jim Cramer Hates This Market

Hey I'm in agreement with Cramer!

"This market is stupid. I continue to believe that the character of this market has changed, and changed dramatically ever since the 'flash crash', when suddenly the public collectively said 'You know what? Enough already! I've had it'."

"Integrity has been violated, and no one believes anything right now."

"The market seems rapacious, arbitrary, capricious and downright ridiculous. It is a tale told by an idiot, full of sound and fury, signifying nothing."

"Today's rally was based on NOTHING."

Here's his 10-minute rant.


Tuesday, June 8, 2010

NYSE Summation Index May Be Rolling Over

What is NYSE Summation Index? The explanation is here (from Decision Point), but what I know, thanks to Breakpoint Trade, is that when the cumulative chart of this rolls over it could be that the market top has been reached.


I've been watching this for the long-term trend change, and it seems it is rolling over after 14 months of uninterrupted uptrend. It could whipsaw, as it did on the way down from the 2007 market top.

Just a quick note.

Thanks to Helicopter Ben's positive comment on the US economy, the stock market futures are green, big time. Dow futures up 96 points, S&P 500 futures up 13 points, Nasdaq 100 futures up almost 20 points. It is so senseless it's comical.

Saturday, June 5, 2010

S&P500 on the Edge of the Wedge

Well, are the US stock indices following BP? Verdict is not in yet, but the indices continue to look pessimistic, having unable to break above 200-DMA. Nasdaq, which did break above 200-DMA, ended Friday below that line again. If the indices gaps down on Monday, then we would know that they indeed followed BP.

Here's the daily chart of S&P500 again, this time a nine-month chart. Notice the expanding wedge (dotted lines), and the index about to break down. In each significant correction since October, the turnaround happened when a candlestick formed with a tiny body and long shadow. This time, we had such a candle formed on May 25, but the market couldn't produce the bounce that held, like it used to.


Also, notice that in each correction the first bounce was sold, and the second bounce from lower point was bought, albeit on a decreasing volume. This time, the first bounce was sold again, but the second bounce hasn't materialized.

The correction pattern got bigger each time, which I'd interpret as reaching a 'critical point' as in physics. (Think of it as increasingly wild, erratic movement of the needle on the seismograph right before the earthquake hits.)

It looks AROON actually crossed over even before the 'flash crash' of May 6.

I remain bearish, and continue to hide behind gold and silver stocks. I'm keeping TZA calls as a small hedge, and I added July puts on FAS on Thursday bounce also as a hedge. They were both doing OK on Friday. Not doing much here. I'm hoping for a small low-volume bounce on Monday to buy puts on the index or puts on leveraged long index or sector ETFs. Maybe long-dated, far out of money 'disaster' puts.

Since algo bots seem to be programmed for index futures and indices. But gold and silver, they are still manipulated by humans at JP Morgan Chase and Deutsche Bank, and somehow they feel safer to me.

Tuesday, June 1, 2010

Are S&P and Dow Following BP?

That's the distinct feeling I've been getting for some time when I see the charts.

Other than pattern recognition, I have no fundamental basis for my assertion. But take a look. It seems the US stock market lags BP by about 2 weeks.

This is BP, from the beginning of this year to May 14. Notice how hard it tried to hang on to $48 line, for 9 trading days. On May 14, it started the second leg down. Today BP eneded nearly 15% down, at $36.52.


Now S&P500. Right now, it is trying to hold on to 1,070 for 8 trading days, having been unable to recapture 200-SMA which is at 1,105. I put two sets of Fibonacci numbers, one from the market top to the bottom of 'flash crash', the other from the post-'flash crash' high to the May 25 low. The flash crash rebound was slightly above 61.8%. After May 25 reversal, the index only managed 50% retracement, hit the 200-SMA, and quickly turned back. Price action is decidedly negative.


On BP chart, MACD histogram (sorry not in the BP chart) was showing positive divergence on May 13, but nonetheless the stock dived the next trading day. S&P is currently showing positive divergence on MACD histogram.

Am I doing any trading based on my ridiculous notion that the market is following BP? Not in particular right now. I am basically sitting on my gold and silver shares and doing OK in this current correction. I wish I heeded my own advice on May 13 and shorted the stock. I still have TZA calls. If 1070 breaks, I may actually go short on the index. My downside target would be 1,000 as psychological support, but I don't see a good enough support until 940-950 area. (See my post from May 19 on Dow.)

As for BP, if it doesn't rebound right here, I don't see a support until it gets below $20, and that's the level in 1995.

2-week delay. If the index was to follow BP, it should do so within the next few days. Patience, patience.