Friday, September 24, 2010

So, Harvest Moon Right After Equinox Did the Trick!

and the Harvest Moon was accompanied by two majestic planets - Jupiter and Uranus. (For more on those astrological portents, read my other blog from Wednesday.)

Congrats to longs, and congrats to anyone holding CENX without trailing stop. Those crooks aka market makers took away my shares when they so artificially slammed the stock yesterday at the open and take out my CENX at the lowest of the day.

Hats off to Takeit on Yahoo board who predicted the gap and run for Friday.

My own tell was alas, sadly, again, Q-man at Tickerville. He was negative on Thursday.

Now where do we stand?

Here's S&P500 daily. Do I see a reverse head and shoulders? Yes I've been seeing that. It looks like a breakout from that pattern to me. The target then is above April high. In between, I think there's a fair chance of the index to at least go as high as 50% retracement (1174, May high after the flash crash) from the neckline (1130) to April high (1219).


If it can retrace all the way and then more and hit the pattern target, then the bigger picture does indicate it could go above 1300. The last time the index was above 1300 was August 2008, right before the cascading crash.

Oh wait, didn't I say that before? Yes I did, but that was right before the flash crash... Oh well, scratch that. Maybe this post on fractal patterns is more like it... Like I say, this is an entertainment, not an advice, ever.

Who knows.. With the Federal Reserve intent on convincing the rest of us that the stock market IS the economy by pumping so much money via QELite (aka POMO) almost every other day...

Monday, September 20, 2010

CENX for Aluminum Shortage Play?

(Well RIMM was a dud...)

I bought a small position on CENX today, after seeing it was breaking out on a larger volume from a nice consolidation pattern that also has a MACD positive divergence.


Then I just read this news at Kitco.com:

"(Kitco News) -Harbor Intelligence looks for three-months aluminum to hit $2,400 per metric ton on the London Metal Exchange in the weeks ahead. Harbor cites expectations that Chinese output will fall, given two years of “negative economics for producers” and pressure on smelters to cut production to meet energy-saving and environmental goals. The most recent data implies that China lost 6%, or a net 982,752 metric tons, of annualized aluminum output in July and August. Meanwhile, demand for semi-aluminum products (autos, construction, etc., which are the main customers of primary output) in China is rising, with a monthly gain of 14% in August, which amounts to annualized output of 2.9 million tons, Harbor says. Ultimately, demand for primary and scrap aluminum will accelerate due to a pick-up in final demand and re-stocking needs for semi-aluminum producers. “Our models show increasing risks of a strong rally in aluminum prices in the final quarter of this year,” Harbor says. A rise toward $2,400 in the fourth quarter will also exert upward pressure on regional aluminum premiums around the world, Harbor adds."

My buy point was $11.62. Trailing stop at 6% loss, first target is a gap-fill above $13.

Thursday, September 16, 2010

Shoulda, Coulda: RIMM

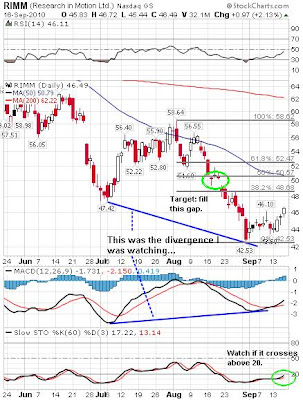
The last RIMM post I had here was late July, for it to break down from $55. Well that happened.

I've been watching RIMM since for several weeks, and I've kept saying to myself, "positive divergence, positive divergence..." in MACD. Despite the analysis of the stock that I read on fundamentals, which are downright dismal, I saw this divergence and I thought "You know what, the stock may pop any time, surprising everyone." And the first target would be $50, I thought to myself just yesterday. Yesterday's close was $45.52.

Well well. It may happen, after all. Research In Motion reported its earnings AH today and it beat estimates. The share price went up 4.54% in after hour trading, to $48.60.

Here's the divergence that I saw and didn't act on it. Oh well. C'est la vie. (Oh BTW, anyone who acted on SIRI, congrats! It took a while but now it seems to be on its way further up.)


If the general market stays up, it may not be too late to buy in. Watch 60-period slow stochastics to see if it crosses above 20 (buy signal). Do your own DD, this post is nothing but entertainment.

(And why don't I listen to my own advice? The whole point of starting this blog was to get it out there so that I would actually see what I think and follow my own advice once in a while...)

Wednesday, September 1, 2010

SIRI May Be Getting Ready to Break Out

Sirius XM Radio Inc. (SIRI) may be ready to break out, if the general market breaks out higher. I don't know anything about the company or its fundamentals; from what I hear it is a POS to say it mildly.

But the daily chart is showing a symmetrical triangle pattern, which is a continuation pattern, and the previous trend was up, albeit erratic. A symmetrical triangle pattern seems to break in the direction of the general market. Resistance at the upper downward trendline, at about $1. Target would be the breakout point plus the height of the triangle = $1.42.


What I like about this recent pattern is that the erratic move of this stock since late last year has calmed down enough to form a constructive pattern. That usually precedes a big move.

Today Nasdaq had a follow-through day with a huge gain on a larger volume. Dow and S&P500, though the gain was significant, didn't have enough volume to qualify as a follow-through day. Maybe after the severe beating that the market took, bit stocks like SIRI may float to the surface rapidly. Just maybe.

But don't take my word for it. This is not an advice or recommendation. Do your own DD.