Wednesday, September 30, 2009

Does It Exist In Nature? - Dow Intraday Chart


You can argue that since it happens in this world, of course it exists in nature.

But watching it intraday, it sure didn't look anything natural that you see in the stock market movement.

It's more like part of desert plateau in Utah... OK so it does exist in nature.


OT: Skimboarders on the Beach

This evening I took out-of-town visitors around the block to the bluff over a beach known locally to be a good one for boogie board. The wind was offshore but the ocean was calm, low tide, and there was no ridable swell; so there was no boogie boarders. As we all sat on the bench, looking over the bay, I noticed a skimboarder appeared. No ridable swell and break for the boogie boarders but since it was low tide, the waves were bouncing off the cliffs on either side of the cove and creating some intricate patterns. Offshore wind was getting stronger, too, adding to the complexity of the patterns.

The skimboarder, in his short wetsuit and looking no more than 15, 16-year old, was intently looking at the waves leaning on his board he set up vertically. He kicked the sand against the board, and waited. He waited for probably good 4 minutes before he finally picked up the board and started running, released the board, and running full-speed to land on the board to ride an intricate beach break for a very speedy, liquid run.

Soon, another skimboarder appeared. And another. Clearly, this particular break, offshore and low-tide, was good for skim boarding. I wanted to figure out how they decided to take off. What were they looking for?

So I started watching the first guy as he gazed across the wave patterns to pick his entry. After 3, 4 rides, I still couldn't figure out. I kept watching. Then he took off, running full-speed, on what looked like just a jumble of white waves dispersing. As he slid off the wet sand into the water, I suddenly saw it. He was riding the lateral wave off the cliff which was being formed underneath his board as a wave as he rode it across the cove!

I could be dead wrong as I don't do skimboard, but I think he was reading not the existing wave pattern but the wave pattern that didn't yet exist but could emerge AS HE RAN TO RIDE IT.

Since his reading was so good, that potential wave pattern would emerge just as he envisioned.

He and other skimboarders rode obvious waves as they broke, occasionally kicking the board high up in the air. But whenever they took off on no conspicuous wave break, the wave materialized under their board like magic, and carried them long and fast across the cove.

It's a keen observation and pattern recognition per excellence. And a split second decision to act on it.

And I kept thinking "He would make a great trader..."

Monday, September 28, 2009

Financials Are Still Lagging

Today, the U.S. stock market did some acrobat again. Overnight, Asian markets were obliterated (particularly Nikkei) partly because of stronger yen potentially hurting the recovery of Japanese exporters. But the U.S. market jumped on the news of M&A.

In the buoyant market with low volume, one sector seems still stuck in the range, and that's financials.

Here's the weekly 2-year chart of financial (unleveraged) ETF, XLF. From the top of May 2007 (financials topped way before the general market did in October-November 2007) to March 2009 low, it has yet to retrace up to 38.2% from the bottom, at $17.37 or over 15% from the current level ($15.08). The slow stochastics set at (60,3) to see the long-term trend is still below 50. CCI set at 233, again to see the long-term trend, is yet to go above -100.

I am still holding FAS that I bought back in March, when XLF was about $9. For XLF to go higher, it needs to hold the trendline, and at least cross over 89-MA - that's about $16.25. The next target would be the 38.2% retracement at $17.37. Around that area is very thin, so it could run up to the 50% retracement at $20.94 - that's close to 40% increase from here.

Well, that's a stretch. No way in hell it's going to reach that level. Or so it seems. But never say never. If XLF jumps 40%, that means FAS will jump 120% (in reality it would be less, maybe 100%). I wouldn't mind having FAS (I still have them) double from here...

But let me remind you this is just looking at the chart. If you read news, it sounds like this is the last sector you should be touching. So far I've been lucky. The technical levels that I'm watching hasn't been breached, and so far there is no reason to sell out longs (unless they are options, which I have a few).

(Why am I hosting the Kellog Raisin Bran ad? Thanks GoogleAds.)

Thursday, September 24, 2009

CNBC a Contrarian Indicator?

One headline at CNBC says "Buy-and-Hold Investing Makes A Return After Turbulent Year" (9/23/09).

Maybe it's time to take the profit from March low...

On the other hand, I hear a chatter that most professional traders have been short or getting short. With the high frequency trading it is very easy to create a stampede like we witnessed yesterday after the FOMC announcement. The market sold off very hard for 90 minutes to the close, non-stop. Certain things doesn't happen in nature, and that sell-off felt like one of those "unnatural" events.

Be careful out there.

Tuesday, September 22, 2009

BIDU's Pennants

Not as conspicuous or well-formed as AAPL's pennants, but Baidu (BIDU) also shows tradable pennants in the Point and Figure chart.

BIDU today breached $400 again intraday, and the stock is nearing all-time high that was recorded in 2007 ($429.19). It already passed the 2008 high of $382.90. If you look at the 3-year daily chart of BIDU, it looks just too wild to do anything with the stock. I briefly traded BIDU (2 days total) over BIDU's earnings using call options. Bought them before the earning, sold after the earnings, double the money, thank you.

But if you look at BIDU in the Point and Figure chart, there were several buy points that wouldn't have lost you money in the correction that came after. They were right at the pennant break. It may be forming another pennant right now, after hitting $408. It could correct back to the previous high, which is around $370.


Not that I am going to buy this stock. I don't know the company well enough, though TA people say it doesn't matter. Still, I don't have a good enough feel for the stock's movement. It already almost quadrupled in price since December 08 low, so the easier trade is probably over.

Sunday, September 20, 2009

Stock Market Analysis from HRA Advisories

I am not a "bull" when it comes to the stock market, even if I am still about 80% long (down from 90% a few weeks ago). I don't think this is a new bull market, I don't buy any of those "green shoots" that certain network TV (one that GE owns, for one) has been breathlessly talking about for the past 6 months.

But I found this commentary at Kitco's website. I thought I may share it.

Time to cash in? (September 2009, HRA Advisories)

The article title doesn't quite reflect the content, though. The authors are saying there are tons of trading opportunities in a current secular bear market, which they agree started in 2000 and we are probably half-way through it.

"We looked at the S&P during the last secular bear in the 1970’s for some insight on how far a bear market rally can go. The S&P chart for this period appears on the following page. As you can see the market basically “went nowhere” from 1968 to 1982, but that flat period included sustained rallies of 55%, 60% and 80%. A more recent example is the rally that occurred from 2003 to 2007. Bear market rally it may have been, but a 4-year 90% rally leaves room for a lot of profitable trading. One could refuse to trade during secular bear markets, that’s an individual choice, but it’s hard to make money sitting on the sidelines for 18 years.

"We’ve seen new bearish lectures about how the market has again gone nowhere for 15 years. True, if you do a straight line point to point measurement using carefully selected dates, but not very meaningful or useful."

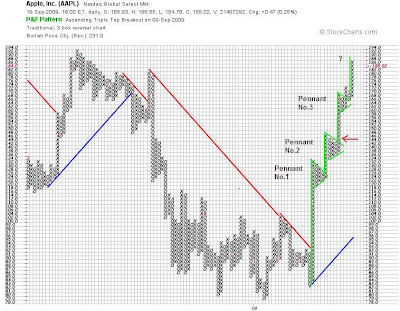
Three Cheers (Pennants) for AAPL

I've been in Apple (AAPL) since the stock was $144. I don't use any of AAPL's products, can't afford Mac. I don't particularly adore Steve Jobs, although he has my sympathy for his illness. I'm not a fan of Apple, but I do like what AAPL has been doing in the stock market.

Here's a daily point and figure chart of AAPL. Notice the triangle pennant No.1 on a high pole. I commented in my posts back in May and June, but as usual I didn't act on it (it was right after the violent upswing of the market since March bottom). Then the stock made another pole and pennant (No.2). I bought AAPL during this second formation. (Timing was lousy, as I didn't follow my own advice of buying the pennant break. I bought before the pennant was formed, and which happened to be the same price as the pennant break. Oh well.)

Then, it formed another (irregular) pennant (No.3) and bolted up again. Translated into a regular candlestick chart, it would mean a strong upward movement followed by a brief quiet (low vol) period of consolidation, and then another strong upward movement followed by another period of consolidation.

It has done this burst/rest (or pole/pennant) pattern 3 times since the stock market March low (AAPL's low was in January, by the way). Currently it may be still doing the "pole" part of the 4th pattern. If you count each occasion as one base, it may still have one or two bases upward before it corrects again.


AAPL's 2008 high was $192.24 in May, and its all-time high of $202.96 was back in December 2007, right before the current market correction started. Remember January 2008, when the indices went down every single day for 3 weeks, paused, then continued going down in February? When all was done, AAPL's share price was almost cut in half. In the correction that started in May 2008 and ended for AAPL in January 2009, AAPL lost nearly 60%. Since then it has gained 137%. It's a wild chart if you look at it in a candlestick chart, looking too scary to touch it anywhere.

Friday, September 18, 2009

Dow 5-day Chart: Ascending Triangle?

It looks to me like "ascending triangle" formation over the two days. Usually the break is to the upside, but since today is a quad-witching day I don't think it will happen. But who knows? It's Mercury Retrograde, after all...


(If a breakout ever occurs out of this pattern (if this is an ascending triangle pattern, that is, LOL), the target for Dow is about 100 points up from here, bringing the index very close to 10,000. DISCLAIMER: I am not not qualified to advise, recommend on the stock market, and this is only for your and my entertainment.)

EOD (end of day), the crooks otherwise known as market makers and specialists, managed to end Dow Jones Industrial Average right on the dot on the lower ascending trendline. The ascending triangle formation is still intact, which may or may not be significant, as this was a quad-witching Op-Ex (option expiration) day.

Wednesday, September 16, 2009

Dow Jones Industrial September 16, 2009

It's about time I revisit the chart of Dow Jones Industrial Average. Why today? Because it's been over a month, and the index was up on a larger volume, and because my once-dessimated portfolio recovered to what it was right before the September-October crash of 2008.

In my August 3 post, I bragged "I Told You So in May, and Sucker's Rally Continues!". I'm not bragging again, but just wanted to mention what I got right almost for the first time since I started actively trading, almost exactly two years ago (right before the market top...). That's about psychology.

"To be really a "sucker's rally", the rally has to threaten to fill the huge gap down created in October 08", I wrote back in May. Whatever the underlying reason or un reason, the market has climbed just like I thought it might, handily beat my first target of 9,300 - 9,400. Right now, Dow is between the 32.8% retracement and 50% retracement from the October 07 market top.

In this Dow 3-year weekly chart, 50% retracement would take the index to about 10,300. That's the middle of the sheer cliff from October 08 crash; very thin resistance (remember those days when Dow dropped 200, 300, 500, 700 points in one day?). I wouldn't be surprised it runs up to 61.2% retracement, which would be around 11,200.

RSI is in uptrending channel, MACD is solidly positive, and slow stochastic is above 50 for the first time since the 2007 market top. It could collapse back so quickly if a next financial disaster hit, but for now they are all good signs, no negative divergence. Only negative divergence I see in the chart is the volume. It's been decreasing ever since the March 09 bottom while the index marches upward ("Rally that no one believes in"). However, the trend may change, as proverbial "performance anxiety" among professional traders, fund managers, and retail investors may intensify.

Tuesday, September 15, 2009

Cramer Believes in the Rally and Much More

CNBC's Mad Money host Jim Cramer just can't understand why people are so negative. He says the housing market is doing great, and will do well even without the government subsidy ($8000 first-time buyer credit), cash for clunkers was such a success. Retail is thriving, banks are solid.

So here it is, Jim Cramer on Mad Money Monday September 14, 2009, one year anniversary of Lehman Brothers bankruptcy which triggered... we know what, don't we?


I am still very much long the market, although I've started to trim my positions by selling partially. I don't believe in the rally when the government is spending like there's no tomorrow (there will be no tomorrow very soon at this rate), sucking up private capital from productive citizens and corporations. The stock market is not the economy, and I'm simply watching the technical parameters so that I can exit before @#$% hits the fan again. Ever since I went gradually long in mid March, the technical levels I'm watching are still not breached.

Monday, September 14, 2009

Rally Nobody Believes In Marches On

Just about every trader whose comment I read and hear wants to short the market or is already short. Then the market does what it does these days, which is to go up.

Quant/algo trading notwithstanding, today's intraday charts of all the major indices - Dow, S&P500, Nasdaq - registered a vertical spike all at the same time, at 2:27 PM EST. S&P Futures spiked at the same time. So far, there is no news that could have triggered it.

Certain patterns does not exist in nature, and this sure looks unnatural. You could possibly argue that the 30 minutes or so before the spike, the indices were sitting flat, getting ready for a pop.

Industrials and utilities supposed to pull the indices higher today. One of my watch list stocks, NOV, had a large volume up-day, ending the day above the overhead resistance of $40-41. I put in a partial order, which didn't fill. Might as well see if it can hold above today's close before I commit.

Tuesday, September 8, 2009

Gold Is Finally Breaking Out!!??

Today (9/8/09), Barrick Gold Corp. (ABX), the world biggest gold producer, announced that it plans to eliminate all of its gold hedges and raise $3 billion in a share offering to help pay for the move, as gold breached $1,000 mark. (AP News link is here.)

Barrick Gold will join Newmont Mining in having their gold positions totally unhedged. They clearly see a plenty of upside and little downside in gold, going forward.

Gold went up to $1007 today, only to reverse back to where it started the day at $995, making the daily candlestick "gravestone doji", a reversal signal. However, I'm not too worried about short-term reversal, because I continue to like what I see longer term. Gold has to correct over 25% from here to get to my cost basis (I have DGP, double-long gold ETN), and like Barrick Gold's CEO I just don't see it happening.

This is Gold continuous contract, 3-year weekly chart. I tend to see the huge reverse head and shoulders formation that has taken 18 months to form. On shorter time horizon (since March this year), I see "ascending triangle pattern". Both patterns share the same neckline. Short-term, a break from the "ascending triangle" would be around $1160 (widest distance in the pattern plus neckline). Longer-term, a break from the "head and shoulders" would be $1320 (head height plus neckline).

However, gold doesn't necessarily move based on technicals. China is calling back its physical gold holdings from London to store them in a newly constructed vault in Hong Kong. It recently allowed its citizens to own and trade physical gold, and is planning gold ETF based on their gold holdings. I suspect gold's huge jump last week was at least partly in response to the news from China. Gold has a potential to break even further up, beyond technicals.

Wednesday, September 2, 2009

Deep-Water Oil Rig Companies to Replace My DXO?

Deutsche Bank is closing out DXO, double-long oil ETN, thanks to the government's regulatory crackdown that is more likely to come sooner than later (margin requirement change, particularly on commodities trading). I had no intention of selling my DXO, and was planning to hold long-term as I see a long inflationary period (even if the economy is in doldrums) ahead.

But as of September 9 (some say it's September 12), I will have no choice but sell my shares back to Deutsche Bank (I think this bank is way extended in commodities markets - soft (ag), oil, and precious metals). Other leveraged long oil ETFs may have a similar risk of being shut down. The very fact that DXO is being shut down but not DTO (double-short oil ETN, also from Deutsche Bank) indicates to me (I could be very wrong, but) that the oil price is going to go up very soon. In order for DBank to create a synthetic double-long position (DXO) someone has to take the other side, and that someone is less and less willing to take that position, either because the oil price will go up soon and he will get royally squeezed, or the new margin requirement is just too much, or both.

So, I am forced to look for alternative plays without using leveraged ETF/ETNs if I think oil is still going up. For that matter, without using any ETF to be extremely safe. (Look what happened to UNG.)

I've started looking for oil-related stocks that are still forming a base. The first batch of such companies are oil rig companies:
  • Transocean (RIG)
  • National Oilwell Varco (NOV)
  • Pride International (PDE)
  • Oceaneering International (OII)
  • McDermott International (MDR)
RIG and PDE provides off-shore contract drilling and OII and MDR are engineering companies who coordinate off-shore oil rig operations. NOV manufactures actual hardware.

BP's newly discovered under-water oil field in Gulf of Mexico, the well was vertically dug 10,000 meters under 1,400 meters of water. It was a job by Transocean, and it is probably the deepest well ever dug in the world.

Anyway, here are the charts. I like RIG, NOV, and PDE, then OII and MDR.