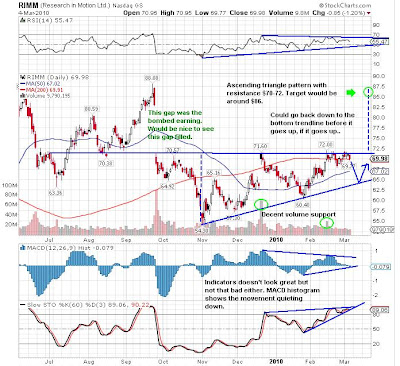
I bought Research in Motion (RIMM) after looking at this nice ascending triangle pattern which has been developing for the past 5 months. Technical indicators are not that great, and a beta stock like RIMM depends on where the general market may be heading. I bought on the candlestick pattern potential, not on the technical indicators.

The target of the pattern would be around $86 (height of the triangle $16 added to the resistance level of $70). That would nicely fill the gap from September 2009 when the stock totally bombed on earnings report.
Depending on the market, it could test the lower ascending trendline again before it either breaks down or goes up and test the resistance and break out. If it's the former, it would be very bearish for the stock, to break down from a bullish chart pattern.
If the pattern doesn't collapse suddenly, I may add April calls. RIMM reports its earnings on March 31.


This comment has been removed by a blog administrator.
ReplyDelete