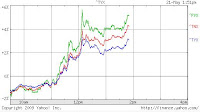
 On Thursday (May 21) I posted this intraday chart of Treasury yields spiking out of nowhere (actually these yields started the day lower than the previous day). And I kept thinking "I've seen the pattern like this before..." but I couldn't remember at that time exactly what.
A sudden revelation happened a few minutes ago so I scrambled out of bed to look for them. So here they are:

The first one is the adjusted monetary base, courtesy of St. Louis Fed.

The second one is the size of the reserve, also from St. Louis Fed.
 The third one is a daily chart of Dow Jones Industrial, from July 1, 2008 to November 24, 2008, flipped upside down and then flipped horizontally.
We tend to think change, any change, takes place gradually. In nature, including the financial markets, that's not always the case. It is often sudden and violent.
Although they are about different events with different time horizons, all these charts show the same characteristics: relative calm all the way up to a sudden, explosive move. There seems to be no stopping when that move is happening. After the initial thrust, they do fall back, but nowhere near the starting point. And they resume the upward thrust soon after.
I don't know how the energy that causes such sudden movement gets dissipated. Can it drop just as sudden? Or will it break the system for ever? Or will it take a very, very long time to repair the damage done? I'd better go back to my books on chaos theory.


No comments:
Post a Comment