Thursday, August 26, 2010

Silver Breaking Out: SLV

Whatever got into the poor man's gold (that's silver) today (8/25/2010), it pretty much had a TA textbook breakout from a pennant or triangle formation.

Here's a 6 month daily chart of SLV, an ETF that tracks silver (and is supposed to be backed by physical silver, though no one with a working brain believe it). This breakout would put the target price of SLV at $20.84.


In a 3-year weekly chart, SLV seems to have formed a cup and handle, and the handle is shaped as a pennant. The target based on that formation is over $30.


I bought SLV when it was slightly below $12 in April 2009 and I have kept it ever since. Unlike my gold ETF (DGP, also a long-term holding), SLV has never dipped below my buy point. I have no intention of selling either of them anytime soon.

I've read analyses by gold/silver bugs saying silver will go much higher percentage-wise than gold. I've seen a target price of $100. Well, if J.P.Morgan Chase is forced to cover its silver naked short positions, that should do the trick...

Tuesday, August 24, 2010

Third Confirmation of Hindenburg Omen Today

or 4th occurrence in 9 trading days (August 12, 19, 20, and 24). For more, see Zero Hedge.

The stock market seems and feels under heavy stress every day, and the struggle gave way today near the close. This is not good for the remaining longs.

Remember the "Cardinal Climax" that was supposed to happen around August 1? Maybe it was delayed and is happening right now...

Friday, August 20, 2010

Second Confirmation of Hindenburg Omen

says Zero Hedge, noting also the Iranian nuclear reactor event on Saturday:

"Longs may be forgiven if they are sweating their long positions over the weekend: not only did we just have a second, and far more solid Hindenburg Omen confirmation today, with 82 new highs, and 94 new lows, but the Saturday is the day when Iran launches its nuclear reactor, and everyone will be very jumpy regarding any piece of news out of the middle east. As for the H.O., the more validations we receive, the greater the confusion in the market, and the greater the possibility for a melt down (or up, as the case may be now that the market is unlike what it has ever been in the past). Furthermore, with implied correlation at record levels (JCJ at around 78), any potential crash will be like never before, as virtually all stocks now go up or down as one, more so than ever before. And should the HFT STOP command take place, the future should be very interesting indeed (at least for the primary dealers, and the Atari consoles which are unable to VWAP dump their holdings in the nano second before stuff goes bidless)."

Be very careful out there. Back to back Hindenburg Omen (see the previous post for the first confirmation, which was yesterday), I bet it's the first...

On the other hand, you could argue that this stock market is so broken with HTF algo-bot infestation, regulatory incompetence (SEC and CFTC), regulatory power-grab (FinReg bill aka Dodd-Frank bill aka Donk bill) that a Hindenburg Omen now occurs regularly, signaling absolutely nothing.

Thursday, August 19, 2010

Uh Oh... Hindenburg Omen Confirmed

From Zero Hedge today:

"Today we got our first Hindenburg Omen confirmation. The number of new highs was 136, and new lows was at 69 (per the traditional WSJ source). Granted this particular criteria set was a little weak as the 69 is precisely on the borderline for confirmation (the 2.2%), and the new highs number was not more than double the new lows (although it was close). Less gating were the McClellan oscillator which was negative at -83.6, and the 10 week MVA, which rose, which were the two remaining conditions. The first omen was spotted on August 12 - a week later the H.O has been confirmed. The more confirmations, the scarier it gets from a technical perspective, not to mention the conversion into a self-fulfilling prophecy (like every other technical indicator)."

As a reminder, the criteria for the Hindenburg Omen is in my August 13 post, one day after the first H.O.

Sunday, August 15, 2010

German Bourse Looks Much Better than US Counterparts

Amid an incredible amount of "doom and gloom" (most recently the Hindenburg Omen), I went looking for a constructive (if not downright cheerful) chart. I'm a contrarian in nature, and when just about everyone (not just people like Gerald Celente and Peter Schiff) is doomy and gloomy, it's either everyone is right for once or everyone is wrong again.

Anyway, I found a constructive chart, and it is German DAX Composite.

The 3-year DAX weekly chart shows the index is still above the 40-MA, unlike the US indices which struggled to fully regain that line and ended the week below. The correction that started in late April looks more like a consolidation, forming an ascending triangle pattern above the 40-MA. If the ascending triangle pattern plays out, the target would be 7027. That's about the target of the point and figure chart also. The index ended the week at 6110.


Germany's economy grew by 2.2% in the second quarter, the fastest in 20 years since the reunification. It grew by making things that people around the world want to buy, even at a premium. It grew DESPITE the government stimulus, which many in Germany acknowledge was misspent and probably unnecessary.

A stark contrast to the US.

Friday, August 13, 2010

Hindenburg Omen on August 12, 2010

Just so you know.

It doesn't mean we will have a market crash, but they say all major market crashes were preceded by the Hindenburg Omen.

The Hindenburg Omen criteria from Wikipedia:

The traditional definition of a Hindenburg Omen has five criteria:

  1. That the daily number of NYSE new 52 Week Highs and the daily number of new 52 Week Lows must both be greater than 2.2 percent of total NYSE issues traded that day.
  2. That the smaller of these numbers is greater than or equal to 69 (68.772 is 2.2% of 3126). This is not a rule but more like a checksum. This condition is a function of the 2.2% of the total issues.
  3. That the NYSE 10 Week moving average is rising.
  4. That the McClellan Oscillator is negative on that same day.
  5. That new 52 Week Highs cannot be more than twice the new 52 Week Lows (however it is fine for new 52 Week Lows to be more than double new 52 Week Highs). This condition is absolutely mandatory.
These measures are calculated each evening using Wall Street Journal figures for consistency. The occurrence of all five criteria on one day is often referred to as an unconfirmed Hindenburg Omen.

A confirmed Hindenburg Omen occurs if a second (or more) Hindenburg Omen signals occur during a 36-day period from the first signal.

The Hindenburg Omen mechanism can be applied to other stock exchanges like Paris, Berlin, Tokyo or Sydney but the criteria for it must overall be the same.

Monday, August 9, 2010

Go with the Index (Bearish) or Individual Stocks (Bullish)?

A bit of a conundrum.

While I continue to wait for FAS to break out (FOMC meeting just in time...), I don't know which way the market may break. On the major indices like Dow and S&P500, I see a rising wedge pattern with declining volume (=bearish) coupled with negative divergence on MACD. But if I look at individual stocks, I see a reverse head and shoulders pattern (=bullish), FAS being one of them.

Here's a take from Matthew Frailey at Breakpoint Trades (from their free newsletter).

Thursday, August 5, 2010

Bull Flag on FAS?

Is it finally breaking out?


(Of course you would have been better off trading JPM or GS for the last month...or even MS.)

Monday, August 2, 2010

CCJ Gapped Up, So Did GLW

A gap up this morning is taking Cameco (CCJ) half way to 50% Fib. And another materials stock that's been on my watch list for eternity is breaking out, too.

Corning (GLW). Like CCJ, I've been watching this for a company-specific, fundamental reason and not TA reason. Yesterday I read about how Corning's super-strong glass from half a century ago was finally finding profitable applications in electronics. I went to look at the chart, and what I saw was a rather sloppy consolidation for the past two weeks or so. I thought it was too sloppy for a decent breakout, but I liked the news of this super-strong glass named Gorilla. Just see the chart today. A huge gap up (up 5%). What do I know...


Materials sector seems particularly strong. Another one that's gapped up today is Freeport-McMoran (FCX). FCX has broken out from a better formed flat-top consolidation (than GLW). Congrats to those who are in these stocks. I wish I were.

Sunday, August 1, 2010

Second Bull Flag on CCJ

Focusing too much on the major indices is not a very smart thing to do if you simply want a good trade. See the trees instead of the forest, in other words. Since algo bots latch on to the indices and index ETFs and a few beta big caps on Nasdaq, some less-known individual stocks may be still relatively free of bots.

Here's one example. Cameco (CCJ) has been on my watch list for very long time. I invested in the stock once, from . I kept watching mainly for macro and fundamental reasons (Cameco is a uranium miner). Last I looked at the chart was more than a year ago, and the stock hasn't gone anywhere. It is actually back to where it was a year ago.

But if you just look at the short-term, it would have been a good enough trade.

This is CCJ's 9-month daily chart. It seems to be forming a second bull flag after breaking out of the first one. There is a positive divergence in MACD and RSI. Slow (very slow at 89) stochastics has already signaled a buy, when it crossed 20, and when it crossed 50. 13-EMA and 34-EMA have also crossed back, signaling a significant trend change.


The stock just passed 38.2% Fibonacci retracement from the July low to the January high. It could go to 50%. Between 50% and 61.8% there seems to be a lot of overhead resistance. If you had bought the stock when the slow stochastics crossed 20, you might be sitting now with 20% gain in a month. Not bad in a volatile market.

Friday, July 30, 2010

Well, Hello Fractals.... Dow 3-Year Chart Now and Then (2008, 2009)

So the 2nd quarter GDP comes in lower than expected, but the obligatory dive of the stock market at the open was quickly eradicated. Dow Jones Industrial Average is down only about 10 points, instead of 100 points. For now, at least (9:30 AM PST).

Nothing to trade here, so I started my game of pattern recognition in the 3-year Dow daily chart. And I'm seeing something interesting. I'm not claiming it definitely, but I'm just sharing.

I see a pattern from October 2008 to June 2009 being repeated, albeit on a smaller scale and shorter time frame: diminution.


We know what happened after April 2009. It seems like QE2 in some form is all but guaranteed. Are we going to have another melt-up on low volume, going into the November election?

But you may also notice that the current pattern looks very similar to the pattern right after the market top, from December 2007 to April 2008. We know what happened after that. The stock market went up in April and May, making TA people giddy with the idea that the chart is forming a big "cup and handle" pattern and that the upside would be so great when that pattern breaks to the upside. And then June came, and it was all downhill from there...


So, take your pick. Or don't pick at all and join people who have been yanking their money from the equity mutual funds.

The Cardinal Climax is coming. Just so you know.

Thursday, July 29, 2010

CBOE's Weeklys on ETFs and Stocks May Be Causing a Range-Bound Market Since June?

Just so you know, too. (I didn't know. H/T liveup)

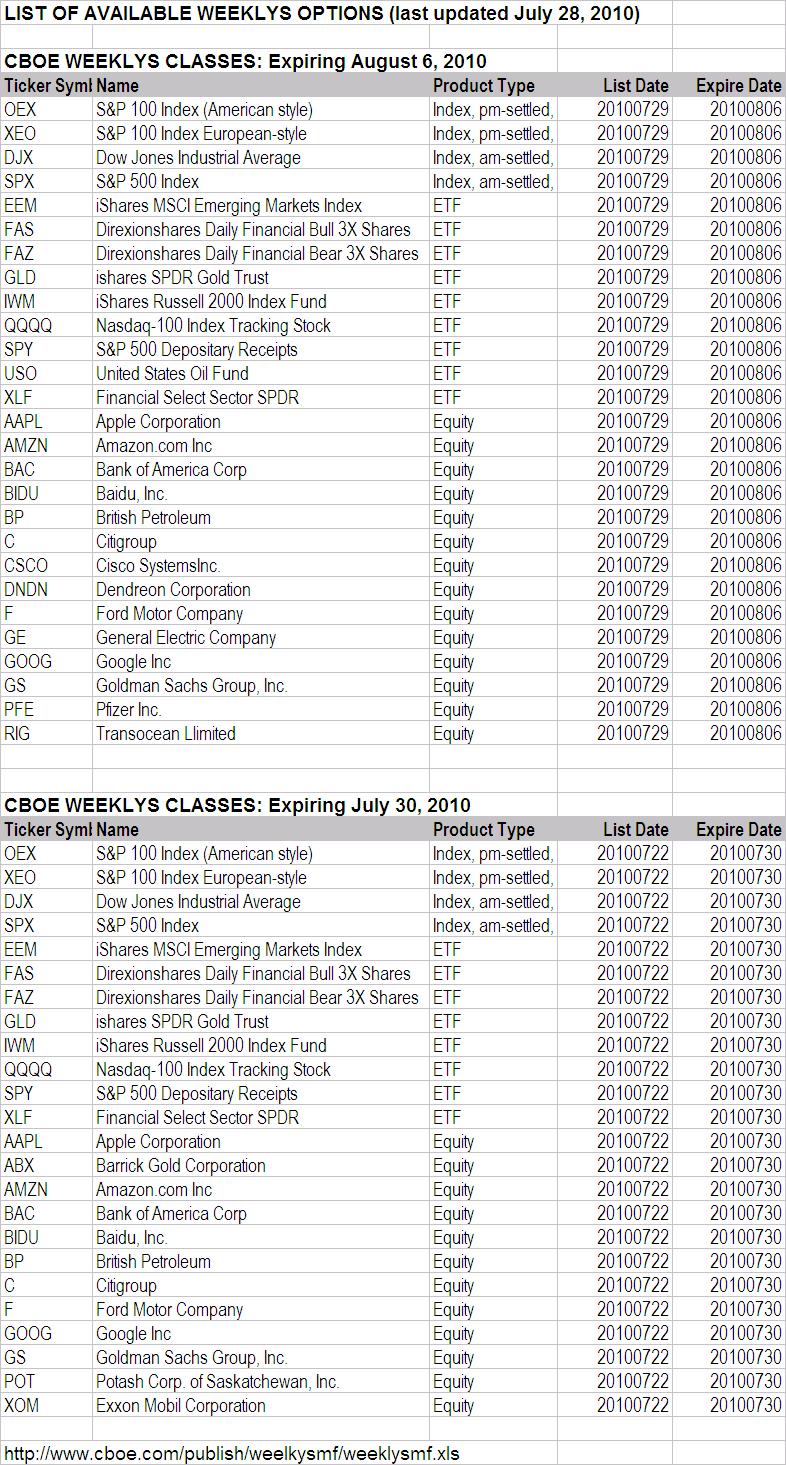
If you trade any of these ETFs and stocks, be aware that they have weekly options (Weeklys) traded on them on top of regular options, courtesy of CBOE (Chicago Board of Options Exchange), that expire every Friday. In case you're wondering why Apple (AAPL) gets hit back to $260 for several weeks, this may be your answer. CBOE has had Weeklys on the indices (S&P 500 and Dow, both American style and European style) since 2005, but the introduction of Weeklys on ETFs and select stocks is a recent event (since June 4, 2010).

ETFs:
SPY (since June 4, 2010)
QQQQ (since June 4, 2010)
DIA (since June 4, 2010)
IWM (since June 4, 2010)
EEM (since July 5, 2010)
USO (since July 5, 2010)
GLD (since July 5, 2010)
XLF (since July 5, 2010)

Stocks:
AAPL (Apple; since June 25, 2010)
BAC (Bank of America; since June 25, 2010)
BP (BP; since June 25, 2010)
C (Citigroup; since June 25, 2010)
F (Ford; since July 5, 2010)
GOOG (Google; since July 5, 2010)

What's more, the individual stocks that will have Weeklys on them seem to vary from week to week. Here's the latest indices, ETFs, and stocks that have Weeklys (table downloaded from CBOE):

(Click on the chart for a better view. If the image doesn't load fast enough, go here and download: http://www.cboe.com/publish/weelkysmf/weeklysmf.xls)

Note to FAS/FAZ traders: They've been range-bound for a reason...

Tuesday, July 27, 2010

Amazon Runs Out of Kindles

(Update 7/28/2010) So RIMM has popped on the news of iPhone killer. I'm not impressed with the move, at least not yet. The stock is yet to take out yesterday's high, which is $55.65. AMZN continues to languish, going nowhere.

-------------------------------

so reports Barron's Tech Trader Daily by Eric Savitz on July 27, 2010. Maybe that's why the stock had a miraculous reversal the day after the earning announcement:

(Quote)
Amazon.com (AMZN) has temporarily run out of Kindles.

Here’s what it says if you attempt to buy the e-Book reader on the company’s Web site:

“Temporarily out of stock. Order now and we’ll deliver when available. We’ll e-mail you with an estimated delivery date as soon as we have more information. Your account will only be charged when we ship the item.”

And what do you see when you go to the Amazon home page? Why, a promo for the extra-big Kindle DX!

As SlashGear notes, the sudden Kindle shortage could mean there has been a surge in demand - or it could mean a next-gen Kindle is on the way.
(Unquote)


That sudden reversal after the earning report has kept my AMZN puts worthless, but I still don't think much of the AMZN chart. Ever since the July top of $124.88 it's on the decline, underperforming the index (Nasdaq). You could say it is resilient, refusing to sell off. But it looks to me like it wants to sell off at any time now. (Of course I'm biased, I have AMZN puts.)

This stock and another Nasdaq beta Research in Motion (RIMM) look to me to be ready to dump. But then the Kindle rumor may be true, and RIMM just announced the iPhone "killer". They may turn on the dime.

Monday, July 26, 2010

AAPL's Peculiar Candlestick Pattern

(UPDATE 7/27/10) So it has popped, for now. Still over 1 hour left in trading. It is yet to take out the Wednesday high of $265.15 to be a textbook "Rising Three Method". The market is iffy, almost scared, after bad news on consumer confidence. Maybe I'll book my gain on August $280 calls...

----------------------------------------

Apple (AAPL) is forming an interesting candlestick pattern. I think it is either "Falling Three Method" or "Rising Three Method". I know I know they are total opposite, but I can't decide. So I let you see the chart.

Here's AAPL's 5-month daily chart. Since late April, the stock hasn't gone anywhere. Except for the flash crash on May 6, it has been range-bound. That itself is interesting, as this is one of the most favorite stocks of algo bots - big cap, high volume, high beta.


Here's the explanation of "Falling Three Method" from Stockcharts.com's Chart School Candlestick Pattern Dictionary:

A bearish continuation pattern. A long black body is followed by three small body days, each fully contained within the range of the high and low of the first day. The fifth day closes at a new low.

And "Rising Three Method":

A bullish continuation pattern in which a long white body is followed by three small body days, each fully contained within the range of the high and low of the first day. The fifth day closes at a new high.

The problem I have in determining the pattern is that the first day (Wednesday last week) was an up day but it was a gap up and sold off all day with the market. That doesn't feel bullish. But then, either pattern is a continuation pattern, and Tuesday was a huge up day.

So, cautiously, I am inclined to say it may be a "Rising Three Method" pattern, which means AAPL will go up tomorrow.

The stock futures are currently down. TA people are calling for a "consolidation" after three consecutive up days.

Well, the major indices registered a pattern called "Three White Soldiers", which is a bullish reversal pattern.

There was a sizeable volume (13,494) on AAPL August $280 call option (OE 36,273).

But the algo bots will do whatever they want to do, and the market can melt up or down on a thin summer volume. GLTA.

Tuesday, July 20, 2010

Large Caps on Turnaround Tuesday Look the Same

I am noticing today that stocks in totally different industries are exhibiting the same pattern on a daily chart. All very bullish candlestick formation (long white candle with hardly any wick), outperforming the general market.

Here are the 6-month daily charts for (from the top):

Las Vegas Sand (LVS)
Nucor (NUE)
Google (GOOG)
Freeport-McMoran (FCX)
J.P.Morgan Chase (JPM)


Don't know what to make of them at this point, other than my guess that algo-bots are simply working the ETFs and index futures so the heavily traded large caps all move the same way regardless of industry or fundamentals.

But even with today's move, these stocks, with the exception of LVS, are either still below 50-DMA or barely touching, or crossing 50-DMA but 200-DMA is still far away. It will take a lot more consolidation to repair the damage.

I personally like LVS (not on the 6-month chart but on the longer charts like 3-year). It was a steal at $1.30 or so in early 2009. It could go up the thin vertical wall that was October 2008 and reach $30. I just don't know when or how. (Casinos in Singapore and Macau, maybe.)

"Turnaround Tuesday" delivered a turnaround. Let's see if they (bots and bots operators) intend to hold it. The Fed chairman Ben S. Bernanke will be testifying in the Congress on Wednesday and Thursday. It could affect the stock market.